About the CoMSES Model Library more info
Our mission is to help computational modelers develop, document, and share their computational models in accordance with community standards and good open science and software engineering practices. Model authors can publish their model source code in the Computational Model Library with narrative documentation as well as metadata that supports open science and emerging norms that facilitate software citation, computational reproducibility / frictionless reuse, and interoperability. Model authors can also request private peer review of their computational models. Models that pass peer review receive a DOI once published.
All users of models published in the library must cite model authors when they use and benefit from their code.
Please check out our model publishing tutorial and feel free to contact us if you have any questions or concerns about publishing your model(s) in the Computational Model Library.
We also maintain a curated database of over 7500 publications of agent-based and individual based models with detailed metadata on availability of code and bibliometric information on the landscape of ABM/IBM publications that we welcome you to explore.
Displaying 10 of 993 results for "M Van Den Hoven" clear search
LAMDA - Learning Agents for Mechanism-Design Analysis
Iris Lorscheid Matthias Meyer | Published Monday, August 08, 2016The simulation model LAMDA investigates the influences of varying cognitive abilities of the decision maker on the truth-inducing effect of the Groves mechanism. Bounded rationality concepts are represented by information states and learning models.
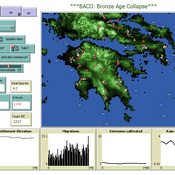
The Bronze Age Collapse model (BACO model)
Marco Vidal-Cordasco | Published Friday, October 09, 2020The Bronze Age Collapse model (BACO model) is written using free NetLogo software v.6.0.3. The purpose of using the BACO model is to develop a tool to identify and analyse the main factors that made the Late Bronze Age and Early Iron Age socio-ecological system resilient or vulnerable in the face of the environmental aridity recorded in the Aegean. The model explores the relationship between dependent and independent variables. Independent variables are: a) inter-annual rainfall variability for the Late Bronze Age and Early Iron Age in the eastern Mediterranean, b) intensity of raiding, c) percentage of marine, agricultural and other calorie sources included in the diet, d) soil erosion processes, e) farming assets, and d) storage capacity. Dependent variables are: a) human pressure for land, b) settlement patterns, c) number of commercial exchanges, d) demographic behaviour, and e) number of migrations.
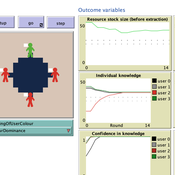
The purpose of the study is to unpack and explore a potentially beneficial role of sharing metacognitive information within a group when making repeated decisions about common pool resource (CPR) use.
We explore the explanatory power of sharing metacognition by varying (a) the individual errors in judgement (myside-bias); (b) the ways of reaching a collective judgement (metacognition-dependent), (c) individual knowledge updating (metacognition- dependent) and d) the decision making context.
The model (AgentEx-Meta) represents an extension to an existing and validated model reflecting behavioural CPR laboratory experiments (Schill, Lindahl & Crépin, 2015; Lindahl, Crépin & Schill, 2016). AgentEx-Meta allows us to systematically vary the extent to which metacognitive information is available to agents, and to explore the boundary conditions of group benefits of metacognitive information.
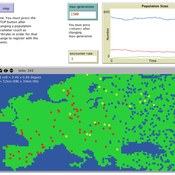
Hominin Ecodynamics v.1.1 (update for perception and interaction)
C Michael Barton | Published Wednesday, August 15, 2012 | Last modified Saturday, April 27, 2013Models land-use, perception, and biocultural interactions between two forager populations.
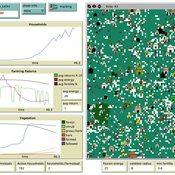
Peer reviewed Swidden Farming Version 2.0
C Michael Barton | Published Wednesday, June 12, 2013 | Last modified Wednesday, September 03, 2014Model of shifting cultivation. All parameters can be controlled by the user or the model can be run in adaptive mode, in which agents innovate and select parameters.
Salzburg Bicycle model
Gudrun Wallentin | Published Saturday, October 29, 2016An ABM to simulate the spatio-temporal distribution of cyclists across the road network of the city of Salzburg.
Kenya ITN Agent-Based Microsimulation (2003–2024)
Wooyoung Kim Hosang Shin | Published Saturday, April 18, 2026An agent-based microsimulation of insecticide-treated net (ITN) distribution and adoption in Kenya (2003–2024), integrating the Theory of Planned Behaviour, Rogers diffusion, Weibull net decay, and a GPS-based two-layer social network. 8,561 household agents calibrated via Approximate Bayesian Computation to six DHS/MIS survey waves, achieving 2.42 pp mean absolute error on Kenya-level ownership. The analysis chain supports mechanism counterfactuals and policy experiments on equity outcomes of ITN distribution strategies.
Peer reviewed Emergence of Organizations out of Garbage Can Dynamics
Guido Fioretti | Published Monday, April 20, 2020 | Last modified Sunday, April 26, 2020The Garbage Can Model of Organizational Choice (GCM) is a fundamental model of organizational decision-making originally propossed by J.D. Cohen, J.G. March and J.P. Olsen in 1972. In their model, decisions are made out of random meetings of decision-makers, opportunities, solutions and problems within an organization.
With this model, these very same agents are supposed to meet in society at large where they make decisions according to GCM rules. Furthermore, under certain additional conditions decision-makers, opportunities, solutions and problems form stable organizations. In this artificial ecology organizations are born, grow and eventually vanish with time.
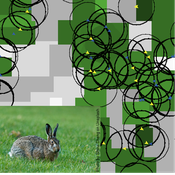
Mitigating bioenergy-driven biodiversity decline: a modelling approach with the European brown hare
Volker Grimm Maria Langhammer | Published Wednesday, November 13, 2019 | Last modified Tuesday, November 24, 2020The model is designed to analyse the effects of mitigation measures on the European brown hare (Lepus europaeus), which is directly affected by ongoing land use change and has experienced widespread decline throughout Europe since the 1960s. As an input, we use two 4×4 km large model landscapes, which were generated by a landscape generator based on real field sizes and crop proportions and differed in average field size and crop composition. The crops grown annually are evaluated in terms of forage suitability, breeding suitability and crop richness for the hare. Six mitigation scenarios are implemented, defined by a 10 % increase in: (1) mixed silphie, (2) miscanthus, (3) grass-clover ley, (4) alfalfa, (5) set-aside, and (6) general crop richness. The model shows that that both landscape configuration and composition have a significant effect on hare population development, which responds particularly strongly to compositional changes.
Peer reviewed Coupled demographic dynamics of herd and household in pastoral systems
Mark Moritz Ian M Hamilton Andrew Yoak Abigail Buffington Chelsea E Hunter Daniel C Peart | Published Saturday, April 08, 2023This purpose of this model is to understand how the coupled demographic dynamics of herds and households constrain the growth of livestock populations in pastoral systems.
Displaying 10 of 993 results for "M Van Den Hoven" clear search