Our mission is to help computational modelers develop, document, and share their computational models in accordance with community standards and good open science and software engineering practices. Model authors can publish their model source code in the Computational Model Library with narrative documentation as well as metadata that supports open science and emerging norms that facilitate software citation, computational reproducibility / frictionless reuse, and interoperability. Model authors can also request private peer review of their computational models. Models that pass peer review receive a DOI once published.
All users of models published in the library must cite model authors when they use and benefit from their code.
Please check out our model publishing tutorial and feel free to contact us if you have any questions or concerns about publishing your model(s) in the Computational Model Library.
Displaying 10 of 253 results for "Julio C%C3%A9sar Acosta%E2%80%93Prado" clear search
CINCH1 (Covid-19 INfection Control in Hospitals)
Nick Gotts | Published Sunday, August 29, 2021CINCH1 (Covid-19 INfection Control in Hospitals), is a prototype model of physical distancing for infection control among staff in University College London Hospital during the Covid-19 pandemic, developed at the University of Leeds, School of Geography. It models the movement of collections of agents in simple spaces under conflicting motivations of reaching their destination, maintaining physical distance from each other, and walking together with a companion. The model incorporates aspects of the Capability, Opportunity and Motivation of Behaviour (COM-B) Behaviour Change Framework developed at University College London Centre for Behaviour Change, and is aimed at informing decisions about behavioural interventions in hospital and other workplace settings during this and possible future outbreaks of highly contagious diseases. CINCH1 was developed as part of the SAFER (SARS-CoV-2 Acquisition in Frontline Health Care Workers – Evaluation to Inform Response) project
(https://www.ucl.ac.uk/behaviour-change/research/safer-sars-cov-2-acquisition-frontline-health-care-workers-evaluation-inform-response), funded by the UK Medical Research Council. It is written in Python 3.8, and built upon Mesa version 0.8.7 (copyright 2020 Project Mesa Team).
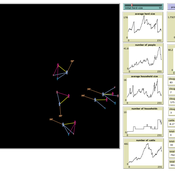
An agent-based simulation of discussion processes in risk workshops
Matthias Meyer Clemens Harten Lucia Bellora-Bienengräber | Published Thursday, September 30, 2021The model measures drivers of effectiveness of risk assessments in risk workshops regarding the correctness and required time. Specifically, we model the limits to information transfer, incomplete discussions, group characteristics, and interaction patterns and investigate their effect on risk assessment in risk workshops.
The model simulates a discussion in the context of a risk workshop with 9 participants. The participants use Bayesian networks to assess a given risk individually and as a group.
Peer reviewed HUMLAND: HUMan impact on LANDscapes agent-based model
Fulco Scherjon Anastasia Nikulina Anhelina Zapolska Maria Antonia Serge Marco Davoli Dave van Wees Katharine MacDonald | Published Monday, October 16, 2023The HUMan impact on LANDscapes (HUMLAND) model has been developed to track and quantify the intensity of different impacts on landscapes at the continental level. This agent-based model focuses on determining the most influential factors in the transformation of interglacial vegetation with a specific emphasis on burning organized by hunter-gatherers. HUMLAND integrates various spatial datasets as input and target for the agent-based model results. Additionally, the simulation incorporates recently obtained continental-scale estimations of fire return intervals and the speed of vegetation regrowth. The obtained results include maps of possible scenarios of modified landscapes in the past and quantification of the impact of each agent, including climate, humans, megafauna, and natural fires.
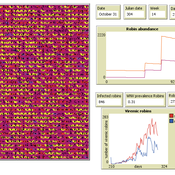
Peer reviewed AMRO_CULEX_WNV
Aniruddha Belsare Jennifer Owen | Published Saturday, February 27, 2021 | Last modified Thursday, March 11, 2021An agent-based model simulating West Nile Virus dynamics in a one host (American robin)-one vector (Culex spp. mosquito) system. ODD improved and code cleaned.
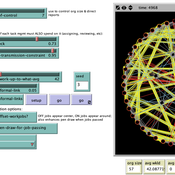
Formal Organization Hierarchy and Informal Networks - "The Company Behind the Org Chart"
Tom Briggs | Published Sunday, April 18, 2021A generalized organizational agent- based model (ABM) containing both formal organizational hierarchy and informal social networks simulates organizational processes that occur over both formal network ties and informal networks.
Narragansett Bay (RI) Recreational Fishery ABM
Tyler Pavlowich Anne Innes-Gold Margaret Heinichen M. Conor McManus Jason McNamee Jeremy Collie Austin Humphries | Published Monday, June 21, 2021This model is based on the Narragansett Bay, RI recreational fishery. The two types of agents are piscivorous fish and fishers (shore and boat fishers are separate “breeds”). Each time step represents one week. Open season is weeks 1-26, assuming fishing occurs during half the year. At each weekly time step, fish agents grow, reproduce, and die. Fisher agents decide whether or not to fish based on their current satisfaction level, and those that do go fishing attempt to catch a fish. If they are successful, they decide whether to keep or release the fish. In our publication, this model was linked to an Ecopath with Ecosim food web model where the commercial harvest of forage fish affected the biomass of piscivorous fish - which then became the starting number of piscivorous fish for this ABM. The number of fish caught in a season of this ABM was converted to a fishing pressure and input back into the food web model.
Peer reviewed Coupled demographic dynamics of herd and household in pastoral systems
Mark Moritz Ian M Hamilton Andrew Yoak Abigail Buffington Chelsea E Hunter Daniel C Peart | Published Saturday, April 08, 2023This purpose of this model is to understand how the coupled demographic dynamics of herds and households constrain the growth of livestock populations in pastoral systems.
Collective Decision Making for Ecological Restoration version 2.0
Dean Massey Moira Zellner Cristy Watkins Jeremy Brooks Kristen Ross Lynne M Westphal | Published Wednesday, November 19, 2014CoDMER v. 2.0 was parameterized with ethnographic data from organizations dealing with prescribed fire and seeding native plants, to advance theory on how collective decisions emerge in ecological restoration.
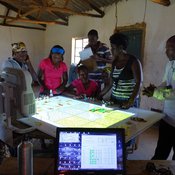
Kulayinjana
Christophe Le Page Arthur Perrotton Michel De Garine-Wichatitsky Barry Bitu Killion Koyisi Ferdinand Mwamba Cephus Ncube Victor Ncube Siphusisiwe Ndlovu Raphael Ngwenya Ambu Nyathi Fumbane Nyathi Patrick Sibanda Zenzo Sibanda | Published Monday, October 03, 2016a computer-based role-playing game simulating the interactions between farming activities, livestock herding and wildlife in a virtual landscape reproducing local socioecological dynamics at the periphery of Hwange National Park (Zimbabwe).
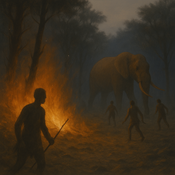
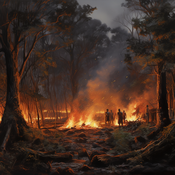
Peer reviewed HUMLAND FIRE-IN-THE-HOLE agent-based model
Fulco Scherjon Anastasia Nikulina | Published Monday, October 20, 2025HUMLAND Fire-in-the-Hole is a conceptual agent-based model (ABM) designed to explore the ecological and behavioral consequences of fire-driven hunting strategies employed by hunter-gatherers, specifically Neanderthals, during the Last Interglacial period around the Neumark-Nord (Germany) archaeological site.
This model builds on and specializes the HUMLAND 1.0.0 model (Nikulina et al. 2024), integrating anthropogenic fires, elephant group behavior, and landscape response to simulate interactions between humans, megafauna, and vegetation over time.
Displaying 10 of 253 results for "Julio C%C3%A9sar Acosta%E2%80%93Prado" clear search