Our mission is to help computational modelers develop, document, and share their computational models in accordance with community standards and good open science and software engineering practices. Model authors can publish their model source code in the Computational Model Library with narrative documentation as well as metadata that supports open science and emerging norms that facilitate software citation, computational reproducibility / frictionless reuse, and interoperability. Model authors can also request private peer review of their computational models. Models that pass peer review receive a DOI once published.
All users of models published in the library must cite model authors when they use and benefit from their code.
Please check out our model publishing tutorial and feel free to contact us if you have any questions or concerns about publishing your model(s) in the Computational Model Library.
Displaying 10 of 144 results for "Sandra H Goff" clear search
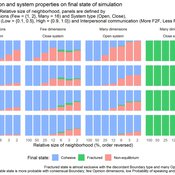
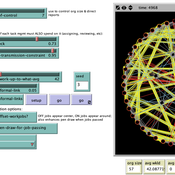
Simulating Components of the Reinforcing Spirals Model and Spiral of Silence
František Kalvas Michael D. Slater Ashley Sanders-Jackson | Published Friday, November 05, 2021Communication processes occur in complex dynamic systems impacted by person attitudes and beliefs, environmental affordances, interpersonal interactions and other variables that all change over time. Many of the current approaches utilized by Communication researchers are unable to consider the full complexity of communication systems or the over time nature of our data. We apply agent-based modeling to the Reinforcing Spirals Model and the Spiral of Silence to better elucidate the complex and dynamic nature of this process. Our preliminary results illustrate how environmental affordances (i.e. social media), closeness of the system and probability of outspokenness may impact how attitudes change over time. Additional analyses are also proposed.
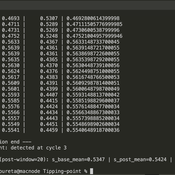
Peer reviewed Green Consumption Tipping Point
Mario | Published Thursday, February 26, 2026This model is a minimal agent-based model (ABM) of green consumption and market tipping dynamics in a stylised two-firm economy. It is designed as an existence proof to illustrate how weak individual preferences, when combined with habit formation, social influence, and firm price adaptation, can generate non-linear transitions (tipping points) in market outcomes.
The economy consists of:
1) Two firms, each supplying a differentiated consumption bundle that differs in its fixed green share (one relatively greener, one less green).
2) Many households, each consuming a unit mass per period and allocating consumption between the two firms.
…
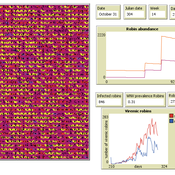
Peer reviewed AMRO_CULEX_WNV
Aniruddha Belsare Jennifer Owen | Published Saturday, February 27, 2021 | Last modified Thursday, March 11, 2021An agent-based model simulating West Nile Virus dynamics in a one host (American robin)-one vector (Culex spp. mosquito) system. ODD improved and code cleaned.
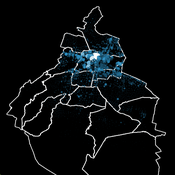
Socio-hydrologicalModel_version_SESMO
Marco Janssen Andres Baeza-Castro Paola Gomez Luis Bojorquez Fidel Serrano-Candela Hallie Eakin Yosune Miquelajauregui Rodrigo Garcia-Herrera | Published Tuesday, February 05, 2019We present here MEGADAPT_SESMO model. A hybrid, dynamic, spatially explicit, integrated model to simulate the vulnerability of urban coupled socio-ecological systems – in our case, the vulnerability of Mexico City to socio-hydrological risk.
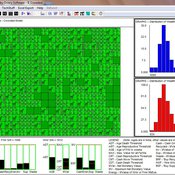
Formal Organization Hierarchy and Informal Networks - "The Company Behind the Org Chart"
Tom Briggs | Published Sunday, April 18, 2021A generalized organizational agent- based model (ABM) containing both formal organizational hierarchy and informal social networks simulates organizational processes that occur over both formal network ties and informal networks.
Risk perception of individuals and the transmission dynamics of COVID-19
Sara Shahin Moghadam Franziska klügel | Published Tuesday, June 27, 2023The purpose of this model is to explore the influence of integrating individuals’ behavioral dynamics in an agent-based model of COVID-19, on the dynamics of disease transmission. The model is an agent-based extention of an established large-scale Individual-based model called STRIDE. Four risk factors determine the individual’s perception of the risk and how they behave accordingly. It is assumed that individuals with higher levels of risk perception adopt higher levels of contact reduction in their daily routines. Individuals can assign different weights to any of the four different risk factors, i.e., the modeler can model different populations and explore how the transmission dynamics vary among them.
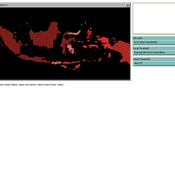
Peer reviewed Agent-based Renewables model for Integrated Sustainable Energy (ARISE)
Anthony Halog Muhammad Indra Al Irsyad Rabindra Nepal | Published Wednesday, November 29, 2017 | Last modified Friday, October 05, 2018ARISE is a hybrid energy model incorporating macroeconomic data, micro socio-economic data, engineering data and environmental data. This version of ARISE can simulate scenarios of solar energy policy for Indonesia case.
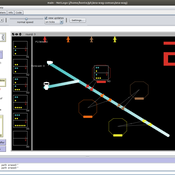
Peer reviewed ana-wag
Géraldine Abrami Mamadou Diallo Stefano Farolfi Bruno Bonté Nils Ferrand Wanda Aquae Gaudi | Published Monday, February 13, 2017 | Last modified Friday, May 10, 2019The ana-wag model, for Analyse Wat-A-Game (WAG), is a NetLogo version of the WAG role playing game. It enables to model a river catchment with the graphical modelling language WAG and to play it as a network-game (each player is a water user).
PowerGen-ABM
Muhammad Indra Al Irsyad Anthony Halog Rabindra Nepal Deddy Priatmodjo Koesrindartoto | Published Sunday, August 04, 2019PowerGen-ABM is an optimisation model for power plant expansions from 2010 to 2025 with Indonesian electricity systems as the case study. PowerGen-ABM integrates three approaches: techno-economic analysis (TEA), linear programming (LP), and input-output analysis (IOA) and environmental analysis. TEA is based on the revenue requirement (RR) formula by UCDavis (2016), and the environmental analysis accounts for resource consumption (i.e., steel, concrete, aluminium, and energy) and carbon dioxide equivalent (CO2e) emissions during the construction and operational stages of power plants.
01a ModEco V2.05 – Model Economies – In C++
Garvin Boyle | Published Monday, February 04, 2013 | Last modified Friday, April 14, 2017Perpetual Motion Machine - A simple economy that operates at both a biophysical and economic level, and is sustainable. The goal: to determine the necessary and sufficient conditions of sustainability, and the attendant necessary trade-offs.
Displaying 10 of 144 results for "Sandra H Goff" clear search