Our mission is to help computational modelers develop, document, and share their computational models in accordance with community standards and good open science and software engineering practices. Model authors can publish their model source code in the Computational Model Library with narrative documentation as well as metadata that supports open science and emerging norms that facilitate software citation, computational reproducibility / frictionless reuse, and interoperability. Model authors can also request private peer review of their computational models. Models that pass peer review receive a DOI once published.
All users of models published in the library must cite model authors when they use and benefit from their code.
Please check out our model publishing tutorial and feel free to contact us if you have any questions or concerns about publishing your model(s) in the Computational Model Library.
Displaying 10 of 115 results for "P W Heijnen" clear search
Success bias imitation increases the probability of effectively dealing with ecological disturbances
Jacopo A. Baggio Vicken Hillis | Published Thursday, April 13, 2017 | Last modified Thursday, August 02, 2018This model aims to investigate how different type of learning (social system) and disturbance specific attributes (ecological system) influence adoption of treatment strategies to treat the effects of ecological disturbances.
Agent modeling (ABM) as a tool to improve the mobility of “avoidant” birds in an ecological corridor in the localities of Chapinero, Teusaquillo, Barrios Unidos and Engativá of Bogotá city [Scenario 2]
Paula Alejandra Meza | Published Thursday, June 25, 2026Considering that two of the three avoider species could not reach the target area in the inittial scenario, five alternative corridor scenarios were created. In all cases, we generated a greater amount of cover area under ‘Urban forest’, including elements such as scattered trees, woody plants, wooded areas, and rows of trees. This covered type was selected since all three species use it as a regular habitat. That is the second sceneario where those ecological parks and other areas inside the capital city were boostered into “urban forest patches” or buffer points, with the idea of improving the survive of the three bird species and their movement. However one of the most restrictive specie was still having movement and survival issues.
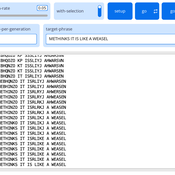
Peer reviewed Dawkins Weasel
Kristin Crouse | Published Thursday, February 08, 2018 | Last modified Wednesday, January 28, 2026Dawkins’ Weasel is a NetLogo model that illustrates the principle of evolution by natural selection. It is inspired by a thought experiment presented by Richard Dawkins in his book The Blind Watchmaker (1996).
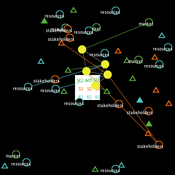
The S-uFUNK Model
Davide Secchi | Published Friday, March 17, 2023This version 2.1.0 of the uFunk model is about setting a business strategy (the S in the name) for an organization. A team of managers (or executives) meet and discuss various options on the strategy for the firm. There are three aspects that they have to agree on to set the strategic positioning of the organization.
The discussion is on market, stakeholders, and resources. The team (it could be a business strategy task force) considers various aspects of these three elements. The resources they use to develop the discussion can come from a traditional approach to strategy or from non-traditional means (e.g., so-called serious play, creativity and imagination techniques).
The S-uFunk 2.1.0 Model wants to understand to which extent cognitive means triggered by traditional and non-traditional resources affect the making of the strategy process.
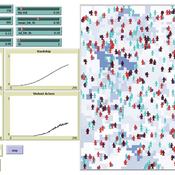
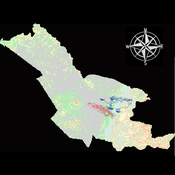
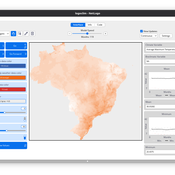
Simulating Climate Stress and Social Instability: An Agent-Based Model of Ecosystem Degradation and Violence in Coastal Communities
Jacopo A. Baggio hurtado-valdivieso | Published Sunday, April 12, 2026This model is an agent-based simulation designed to explore how climate-induced environmental degradation can contribute to the emergence of social violence in coastal communities that depend heavily on ecosystem services for their livelihoods. The model represents a coupled social–ecological system in which environmental shocks—such as sea level rise and marine ecosystem decline—affect local economic conditions, food security, and community stability.
Agents in the model represent individuals whose livelihoods depend on coastal ecosystems. Environmental degradation reduces ecosystem productivity and increases economic hardship, which can lead to the formation of grievances among agents. The model incorporates behavioral thresholds that determine how individuals respond to hardship and perceived injustice. Under certain conditions—particularly when institutional capacity and law enforcement effectiveness are limited—these grievances may escalate into violent behavior.
The simulation allows users to explore how different climate scenarios, levels of ecosystem degradation, livelihood dependence, and institutional responses influence the probability of social instability and violence. By modeling the interactions between environmental stress, socio-economic vulnerability, and governance capacity, the model provides a computational framework for examining potential pathways linking climate change and conflict in coastal social–ecological systems.
…
Individual bias and organizational objectivity
Bo Xu | Published Monday, April 15, 2013 | Last modified Monday, April 08, 2019This model introduces individual bias to the model of exploration and exploitation, simulates knowledge diffusion within organizations, aiming to investigate the effect of individual bias and other related factors on organizational objectivity.
Prisoner's Tournament
Kristin Crouse | Published Wednesday, November 06, 2019 | Last modified Wednesday, December 15, 2021This model replicates the Axelrod prisoner’s dilemma tournaments. The model takes as input a file of strategies and pits them against each other to see who achieves the best payoff in the end. Change the payoff structure to see how it changes the tournament outcome!
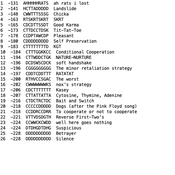
LogoClim: WorldClim in NetLogo
Daniel Vartanian Leandro Garcia Aline Martins de Carvalho Aline | Published Thursday, July 03, 2025 | Last modified Tuesday, September 16, 2025LogoClim is a NetLogo model for simulating and visualizing global climate conditions. It allows researchers to integrate high-resolution climate data into agent-based models, supporting reproducible research in ecology, agriculture, environmental sciences, and other fields that rely on climate data.
The model utilizes raster data to represent climate variables such as temperature and precipitation over time. It incorporates historical data (1951-2024) and future climate projections (2021-2100) derived from global climate models under various Shared Socioeconomic Pathways (SSPs, O’Neill et al., 2017). All climate inputs come from WorldClim 2.1, a widely used source of high-resolution, interpolated climate datasets based on weather station observations worldwide (Fick & Hijmans, 2017).
LogoClim follows the FAIR Principles for Research Software (Barker et al., 2022) and is openly available on the CoMSES Network and GitHub. See the Logônia model for an example of its integration into a full NetLogo simulation.
MayaSim: An agent-based model of the ancient Maya social-ecological system
Scott Heckbert | Published Wednesday, July 11, 2012 | Last modified Tuesday, July 02, 2013MayaSim is an agent-based, cellular automata and network model of the ancient Maya. Biophysical and anthropogenic processes interact to grow a complex social ecological system.
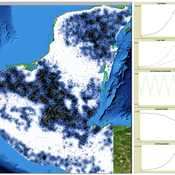
Human-in-the-loop Experiment of the Strategic Coalition Formation using the glove game
Andrew Collins | Published Monday, November 23, 2020 | Last modified Wednesday, June 22, 2022The purpose of the model is to collect information on human decision-making in the context of coalition formation games. The model uses a human-in-the-loop approach, and a single human is involved in each trial. All other agents are controlled by the ABMSCORE algorithm (Vernon-Bido and Collins 2020), which is an extension of the algorithm created by Collins and Frydenlund (2018). The glove game, a standard cooperative game, is used as the model scenario.
The intent of the game is to collection information on the human players behavior and how that compares to the computerized agents behavior. The final coalition structure of the game is compared to an ideal output (the core of the games).
Displaying 10 of 115 results for "P W Heijnen" clear search