
Daniel Vartanian
AffiliationsUniversidade de São Paulo, Resiclima Network, rOpenSci, Sustentarea Research and Extension Center, Center for Metropolitan Studies
Personal homepage ORCID more infohttps://orcid.org/0000-0001-7782-759X
GitHub more info
Olá, I’m Daniel! 👋
I’m an R(esearcher) at the University of São Paulo (USP) working on complex systems and data science. My family name is actually KACHvartanian, but I go by Vartanian to save everyone from a linguistic workout.
I love building open-source tools, being part of active communities, and working with the R, Python, and NetLogo programming languages. When I’m not coding, I’m likely watching a good movie, seeing friends, wandering through new places, or tinkering with some obscure new thing that may or may not go anywhere.
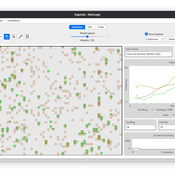
Logônia: Plant Growth Response Model in NetLogo
Daniel Vartanian Leandro Garcia Aline | Published Saturday, September 13, 2025 | Last modified Monday, July 13, 2026Logônia is a NetLogo model that simulates the growth response of a fictional plant, Logônia, under different climatic conditions. The model uses climate data from WorldClim 2.1 (Fick & Hijmans, 2017) and demonstrates how to integrate the LogoClim model through the LevelSpace extension.
The model was developed according to the FAIR principles for research software (Barker et al., 2022) and is openly available on the CoMSES Network and GitHub.
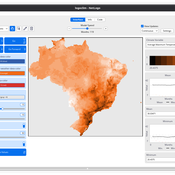
LogoClim: WorldClim in NetLogo
Daniel Vartanian Leandro Garcia Aline Martins de Carvalho Aline | Published Thursday, July 03, 2025 | Last modified Monday, July 13, 2026LogoClim is a NetLogo model designed to be integrated into other simulations through the LevelSpace extension (Hjorth et al., 2020), providing high resolution climate data from sources validated and used by the Intergovernmental Panel on Climate Change (IPCC).
The model simplifies and standardizes the integration of climate data into NetLogo, allowing researchers to focus their efforts on the model itself with the assurance of using reliable and widely recognized data. Although its main use is as a component of larger simulations, LogoClim also has its own graphical interface for monitoring and checking the datasets.
The climate data comes from the WorldClim 2.1 project (Fick & Hijmans, 2017), for which LogoClim works as an interface to NetLogo. The model supports all three WorldClim data series: (1) Historical Climate Data (1970 to 2000), with 12 monthly points for minimum, mean, and maximum temperature, precipitation, solar radiation, wind speed, vapor pressure, elevation, and bioclimatic variables; (2) Historical Monthly Weather Data (1951 to 2024), based on downscaling of CRU-TS-4.09, developed by the Climatic Research Unit at the University of East Anglia (Harris et al., 2020), with minimum and maximum temperature and total precipitation; and (3) Future Climate Data, based on downscaling climate projections derived from global climate models of the Coupled Model Intercomparison Project Phase 6 (CMIP6) (Eyring et al., 2016) for four future periods (2021 to 2040, 2041 to 2060, 2061 to 2080, and 2081 to 2100) and four scenarios based on the Shared Socioeconomic Pathways (SSPs 126, 245, 370, and 585), covering minimum and maximum temperature, total precipitation, and bioclimatic variables. All series are available at multiple spatial resolutions, from 10 minutes (about 340 km² at the equator) to 30 seconds (about 1 km² at the equator).
…
Under development.