Our mission is to help computational modelers develop, document, and share their computational models in accordance with community standards and good open science and software engineering practices. Model authors can publish their model source code in the Computational Model Library with narrative documentation as well as metadata that supports open science and emerging norms that facilitate software citation, computational reproducibility / frictionless reuse, and interoperability. Model authors can also request private peer review of their computational models. Models that pass peer review receive a DOI once published.
All users of models published in the library must cite model authors when they use and benefit from their code.
Please check out our model publishing tutorial and feel free to contact us if you have any questions or concerns about publishing your model(s) in the Computational Model Library.
Displaying 10 of 954 results for "Am Vaes - Van De Hulsbeek" clear search
Peer reviewed E³-MAN. An Institutionally-guided multi-agent. Model for fair and efficient negotiation.
José luis bustelo | Published Monday, September 01, 2025Negotiation plays a fundamental role in shaping human societies, underpinning conflict resolution, institutional design, and economic coordination. This article introduces E³-MAN, a novel multi-agent model for negotiation that integrates individual utility maximization with fairness and institutional legitimacy. Unlike classical approaches grounded solely in game theory, our model incorporates Bayesian opponent modeling, transfer learning from past negotiation domains, and fallback institutional rules to resolve deadlocks. Agents interact in dynamic environments characterized by strategic heterogeneity and asymmetric information, negotiating over multidimensional issues under time constraints. Through extensive simulation experiments, we compare E³-MAN against the Nash bargaining solution and equal-split baselines using key performance metrics: utilitarian efficiency, Nash social welfare, Jain fairness index, Gini coefficient, and institutional compliance. Results show that E³-MAN achieves near-optimal efficiency while significantly improving distributive equity and agreement stability. A legal application simulating multilateral labor arbitration demonstrates that institutional default rules foster more balanced outcomes and increase negotiation success rates from 58% to 98%. By combining computational intelligence with normative constraints, this work contributes to the growing field of socially aware autonomous agents. It offers a virtual laboratory for exploring how simple institutional interventions can enhance justice, cooperation, and robustness in complex socio-legal systems.

Peer reviewed HUMLAND FIRE-IN-THE-HOLE agent-based model
Fulco Scherjon Anastasia Nikulina | Published Monday, October 20, 2025HUMLAND Fire-in-the-Hole is a conceptual agent-based model (ABM) designed to explore the ecological and behavioral consequences of fire-driven hunting strategies employed by hunter-gatherers, specifically Neanderthals, during the Last Interglacial period around the Neumark-Nord (Germany) archaeological site.
This model builds on and specializes the HUMLAND 1.0.0 model (Nikulina et al. 2024), integrating anthropogenic fires, elephant group behavior, and landscape response to simulate interactions between humans, megafauna, and vegetation over time.
Mission San Diego Model
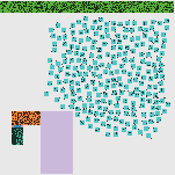
Carolyn Orbann | Published Monday, April 15, 2019The Mission San Diego model is an epidemiological model designed to test hypotheses related to the spread of the 1805-1806 measles epidemic among indigenous residents of Mission San Diego during the early mission period in Alta California. The model community is based on the population of the Mission San Diego community, as listed in the parish documents (baptismal, marriage, and death records). Model agents are placed on a map-like grid that consists of houses, the mission church, a women’s dormitory (monjeria) adjacent to the church, a communal kitchen, priest’s quarters, and agricultural fields. They engage in daily activities that reflect known ethnographic patterns of behavior at the mission. A pathogen is introduced into the community and then it spreads throughout the population as a consequence of individual agent movements and interactions.
Soy2Grow-ABM-V1
Siavash Farahbakhsh | Published Monday, January 20, 2025The Soy2Grow ABM aims to simulate the adoption of soybean production in Flanders, Belgium. The model primarily considers two types of agents as farmers: 1) arable and 2) dairy farmers. Each farmer, based on its type, assesses the feasibility of adopting soybean cultivation. The feasibility assessment depends on many interrelated factors, including price, production costs, yield, disease, drought (i.e., environmental stress), social pressure, group formations, learning and skills, risk-taking, subsidies, target profit margins, tolerance to bad experiences, etc. Moreover, after adopting soybean production, agents will reassess their performance. If their performance is unsatisfactory, an agent may opt out of soy production. Therefore, one of the main outcomes to look for in the model is the number of adopters over time.
The main agents are farmers. Generally, factors influencing farmers’ decision-making are divided into seven main areas: 1) external environmental factors, 2) cooperation and learning (with slight differences depending on whether they are arable or dairy farmers), 3) crop-specific factors, 4) economics, 5) support frameworks, 6) behavioral factors, and 7) the role of mobile toasters (applicable only to dairy farmers).
Moreover, factors not only influence decision-making but also interact with each other. Specifically, external environmental factors (i.e., stress) will result in lower yield and quality (protein content). The reducing effect, identified during participatory workshops, can reach 50 %. Skills can grow and improve yield; however, their growth has a limit and follows different learning curves depending on how individualistic a farmer is. During participatory workshops, it was identified that, contrary to cooperative farmers, individualistic farmers may learn faster and reach their limits more quickly. Furthermore, subsidies directly affect revenues and profit margins; however, their impact may disappear when they are removed. In the case of dairy farmers, mobile toasters play an important role, adding toasting and processing costs to those producing soy for their animal feed consumption.
Last but not least, behavioral factors directly influence the final adoption decision. For example, high risk-taking farmers may adopt faster, whereas more conservative farmers may wait for their neighbors to adopt first. Farmers may evaluate their success based on their own targets and may also consider other crops rather than soy.
Peer reviewed Garbage can model Excel reconstruction
Smarzhevskiy Ivan | Published Tuesday, August 19, 2014 | Last modified Tuesday, July 30, 2019Reconstruction of the original code M. Cohen, J. March, and J. Olsen garbage can model, realized by means of Microsoft Office Excel 2010
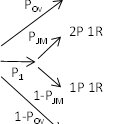
Peer reviewed Garbage can model NetLogo implementation
Smarzhevskiy Ivan | Published Sunday, February 14, 2016 | Last modified Tuesday, July 30, 2019It is NetLogo reconstruction of the original FORTRAN code of the classical M. Cohen, J. March, and J. Olsen “garbage can model” (GCM or CMO) of collective decision-making.
Peer reviewed SequiaBasalto model
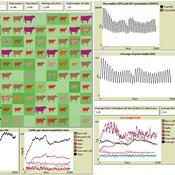
Marco Janssen Irene Perez Ibarra Pierre Bommel Diego J. Soler-Navarro Alicia Tenza Peral Francisco Dieguez Cameroni | Published Friday, May 26, 2023This is a replication of the SequiaBasalto model, originally built in Cormas by Dieguez Cameroni et al. (2012, 2014, Bommel et al. 2014 and Morales et al. 2015). The model aimed to test various adaptations of livestock producers to the drought phenomenon provoked by climate change. For that purpose, it simulates the behavior of one livestock farm in the Basaltic Region of Uruguay. The model incorporates the price of livestock, fodder and paddocks, as well as the growth of grass as a function of climate and seasons (environmental submodel), the life cycle of animals feeding on the pasture (livestock submodel), and the different strategies used by farmers to manage their livestock (management submodel). The purpose of the model is to analyze to what degree the common management practices used by farmers (i.e., proactive and reactive) to cope with seasonal and interannual climate variations allow to maintain a sustainable livestock production without depleting the natural resources (i.e., pasture). Here, we replicate the environmental and livestock submodel using NetLogo.
One year is 368 days. Seasons change every 92 days. Each day begins with the growth of grass as a function of climate and season. This is followed by updating the live weight of cows according to the grass height of their patch, and grass consumption, which is determined based on the updated live weight. After consumption, cows grow and reproduce, and a new grass height is calculated. Cows then move to the patch with less cows and with the highest grass height. This updated grass height value will be the initial grass height for the next day.
Leviathan model and its approximation
Thibaut Roubin Guillaume Deffuant | Published Thursday, September 17, 2020 | Last modified Monday, September 06, 2021The model is based on the influence function of the Leviathan model (Deffuant, Carletti, Huet 2013 and Huet and Deffuant 2017). We aim at better explaining some patterns generated by this model, using a derived mathematical approximation of the evolution of the opinions averaged.
We consider agents having an opinion/esteem about each other and about themselves. During dyadic meetings, agents change their respective opinion about each other, and possibly about other agents they gossip about, with a noisy perception of the opinions of their interlocutor. Highly valued agents are more influential in such encounters.
We show that the inequality of reputations among agents have a negative effect on the opinions about the agents of low status.The mathematical analysis of the opinion dynamic shows that the lower the status of the agent, the more detrimental the interactions are for the opinions about this agent, especially when gossip is activated, while the interactions always tend to increase the opinions about agents of high status.
Peer reviewed Organizational behavior in the hierarchy model
Smarzhevskiy Ivan | Published Tuesday, June 18, 2019 | Last modified Wednesday, July 31, 2019In a two-level hierarchical structure (consisting of the positions of managers and operators), persons holding these positions have a certain performance and the value of their own (personal perception in this, simplified, version of the model) perception of each other. The value of the perception of each other by agents is defined as a random variable that has a normal distribution (distribution parameters are set by the control elements of the interface).
In the world of the model, which is the space of perceptions, agents implement two strategies: rapprochement with agents that perceive positively and distance from agents that perceive negatively (both can be implemented, one of these strategies, or neither, the other strategy, which makes the agent stationary). Strategies are implemented in relation to those agents that are in the radius of perception (PerRadius).
The manager (Head) forms a team of agents. The performance of the group (the sum of the individual productivities of subordinates, weighted by the distance from the leader) varies depending on the position of the agents in space and the values of their individual productivities. Individual productivities, in the current version of the model, are set as a random variable distributed evenly on a numerical segment from 0 to 100. The manager forms the team 1) from agents that are in (organizational) radius (Op_Radius), 2) among agents that the manager perceives positively and / or negatively (both can be implemented, one of the specified rules, or neither, which means the refusal of the command formation).
Agents can (with a certain probability, given by the variable PrbltyOfDecisn%), in case of a negative perception of the manager, leave his group permanently.
It is possible in the model to change on the fly radii values, update the perception value across the entire population and the perception of an individual agent by its neighbors within the perception radius, and the probability values for a subordinate to make a decision about leaving the group.
You can also change the set of strategies for moving agents and strategies for recruiting a team manager. It is possible to add a randomness factor to the movement of agents (Stoch_Motion_Speed, the default is set to 0, that is, there are no random movements).
…
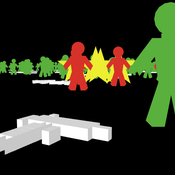
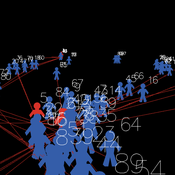
Peer reviewed NetLogo model of USA mass shootings
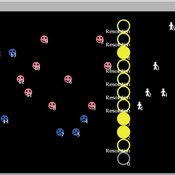
Smarzhevskiy Ivan | Published Tuesday, September 24, 2019 | Last modified Tuesday, April 14, 2020Is the mass shooter a maniac or a relatively normal person in a state of great stress? According to the FBI report (Silver, J., Simons, A., & Craun, S. (2018). A Study of the Pre-Attack Behaviors of Active Shooters in the United States Between 2000 – 2013. Federal Bureau of Investigation, U.S. Department of Justice,Washington, D.C. 20535.), only 25% of the active shooters were known to have been diagnosed by a mental health professional with a mental illness of any kind prior to the offense.
The main objects of the model are the humans and the guns. The main factors influencing behavior are the population size, the number of people with mental disabilities (“psycho” in the model terminology) per 100,000 population, the total number of weapons (“guns”) in the population, the availability of guns for humans, the intensity of stressors affecting humans and the threshold level of stress, upon reaching which a person commits an act of mass shooting.
The key difference (in the model) between a normal person and a psycho is that a psycho accumulates stressors and, upon reaching a threshold level, commits an act of mass shooting. A normal person is exposed to stressors, but reaching the threshold level for killing occurs only when the simultaneous effect of stressors on him exceeds this level.
The population dynamics are determined by the following factors: average (normally distributed) life expectancy (“life_span” attribute of humans) and population growth with the percentage of newborns set by the value of the TickReprRatio% slider of the current population volume from 16 to 45 years old.Thus, one step of model time corresponds to a year.
Displaying 10 of 954 results for "Am Vaes - Van De Hulsbeek" clear search