Our mission is to help computational modelers develop, document, and share their computational models in accordance with community standards and good open science and software engineering practices. Model authors can publish their model source code in the Computational Model Library with narrative documentation as well as metadata that supports open science and emerging norms that facilitate software citation, computational reproducibility / frictionless reuse, and interoperability. Model authors can also request private peer review of their computational models. Models that pass peer review receive a DOI once published.
All users of models published in the library must cite model authors when they use and benefit from their code.
Please check out our model publishing tutorial and feel free to contact us if you have any questions or concerns about publishing your model(s) in the Computational Model Library.
Displaying 10 of 120 results structure clear search
Negotiation Lab 1.0
Julián Arévalo | Published Friday, March 20, 2026Negotiation Lab 1.0 is an agent-based model of peace negotiations that explores how the parties’ readiness — their motivation and optimism to engage in talks — evolves dynamically throughout the negotiation process. The model reconceptualizes readiness as an adaptive state variable that is continuously updated through feedback from negotiation outcomes, rather than a static precondition assessed at the onset of talks.
The model simulates two parties negotiating a multi-issue agenda. In each round, parties allocate effort to the current sub-issue; outcomes depend on their joint effort and a stochastic component representing external factors. Results feed back into each party’s readiness, shaping subsequent engagement. The negotiation ends either when all agenda items are resolved (agreement) or when a party’s readiness falls below a critical threshold (breakdown).
Key parameters include the initial readiness of each party, agenda structure (balanced, hard, easy, red, or random), type of negotiation (from highly cooperative to highly competitive), and each party’s effort strategy (always high, always low, random, or pseudo tit-for-tat). The model shows that while initial readiness is associated with negotiation outcomes, it is neither necessary nor sufficient to determine them: process variables — the type of interaction, agenda design, and adaptive effort strategies — exert comparatively larger effects on outcomes. Identical initial conditions can produce widely divergent trajectories, illustrating path dependence and sensitivity to feedback dynamics.
The model is implemented in NetLogo 7.0 and is documented using the ODD+D protocol. It is associated with the paper “Beyond Initial Conditions: How Adaptive Readiness Shapes Peace Negotiation Outcomes” (Arévalo, under review).
Exploring the aftermath of transition failures: An agent-based model
Gangmin Park Junmin Lee Jisoo Lee Keungoui Kim | Published Friday, March 06, 2026This computational model is an agent-based model (ABM) developed to investigate how repeated failures of emerging niches accumulate and influence the trajectory of socio-technical transitions. Built in AnyLogic 8.7.11, the model simulates the dynamic interactions between a dominant regime and sequential niche entrants within a two-dimensional practice space. It models alignment, movement, and competition based on technological maturity and market penetration. The model utilizes a reinforcing feedback structure linking consumer support, output, resource accumulation, and capacity development (Physical and Institutional Capacity). A complete model specification following the ODD+D (Overview, Design concepts, Details, and Decision) protocol is included in the documentation.
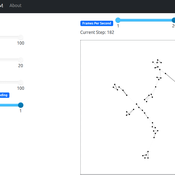
Peer reviewed Green Consumption Tipping Point
Mario | Published Thursday, February 26, 2026This model is a minimal agent-based model (ABM) of green consumption and market tipping dynamics in a stylised two-firm economy. It is designed as an existence proof to illustrate how weak individual preferences, when combined with habit formation, social influence, and firm price adaptation, can generate non-linear transitions (tipping points) in market outcomes.
The economy consists of:
1) Two firms, each supplying a differentiated consumption bundle that differs in its fixed green share (one relatively greener, one less green).
2) Many households, each consuming a unit mass per period and allocating consumption between the two firms.
…
Bargaining with misvaluation
Marcin Czupryna | Published Wednesday, January 14, 2026Subjective biases and errors systematically affect market equilibria, whether at the population level or in bilateral trading. Here, we consider the possibility that an agent engaged in bilateral trading is mistaken about her own valuation of the good she expects to trade, that has not been explicitly incorporated into the existing bilateral trade literature. Although it may sound paradoxical that a subjective private valuation is something an agent can be mistaken about, as it is up to her to fix it, we consider the case in which that agent, seller or buyer, consciously or not, given the structure of a market, a type of good, and a temporary lack of information, may arrive at an erroneous valuation. The typical context through which this possibility may arise is in relation with so-called experience goods, which are sold while all their intrinsic qualities are still unknown (such as untasted bottled fine wines). We model this “private misvaluation” phenomenon in our study. The agents may also be mistaken about how their exchange counterparties are themselves mistaken. Formally, they attribute a certain margin of error to the other agent, which can differ from the actual way that another agent misvalues the good under consideration. This can constitute the source of a second-order misvaluation. We model different attitudes and situations in which agents face unexpected signals from their counterparties and the manner and extent to which they revise their initial beliefs. We analyse and simulate numerically the consequences of first-order and second-order misvaluation on market equilibria.
Peer reviewed The effect of homophily on co-offending outcomes
Ruslan Klymentiev Christophe Vandeviver Luis E. C. Rocha | Published Friday, September 26, 2025This Agent-Based Model is designed to simulate how similarity-based partner selection (homophily) shapes the formation of co-offending networks and the diffusion of skills within those networks. Its purpose is to isolate and test the effects of offenders’ preference for similar partners on network structure and information flow, under controlled conditions.
In the model, offenders are represented as agents with an individual attribute and a set of skills. At each time step, agents attempt to select partners based on similarity preference. When two agents mutually select each other, they commit a co-offense, forming a tie and exchanging a skill. The model tracks the evolution of network properties (e.g., density, clustering, and tie strength) as well as the spread of skills over time.
This simple and theoretical model does not aim to produce precise empirical predictions but rather to generate insights and test hypotheses about the trade-off between partnership stability and information diffusion. It provides a flexible framework for exploring how changes in partner selection preferences may lead to differences in criminal network dynamics. Although the model was developed to simulate offenders’ interactions, in principle, it could be applied to other social processes involving social learning and skills exchange.
…
Urban Teacher Lifecycle and Mobility
Yevgeny Patarakin | Published Wednesday, July 23, 2025This agent-based model simulates the lifecycle, movement, and satisfaction of teachers within an urban educational system composed of multiple universities and schools. Each teacher agent transitions through several possible roles: newcomer, university student, unemployed graduate, and employed teacher. Teachers’ pathways are shaped by spatial configuration, institutional capacities, individual characteristics, and dynamic interactions with schools and universities. Universities are assigned spatial locations with a controllable level of centralization and are characterized by academic ratings, capacity, and alumni records. Schools are distributed throughout the city, each with a limited number of vacancies, hiring requirements, and offered salaries. Teachers apply to universities based on the alignment of their personal academic profiles with institutional ratings, pursue studies, and upon graduation become candidates for employment at schools.
The employment process is driven by a decentralized matching of teacher expectations and school offers, taking into account factors such as salary, proximity, and peer similarity. Teachers’ satisfaction evolves over time, reflecting both institutional characteristics and the composition of their colleagues; low satisfaction may prompt teachers to transfer between schools within their mobility radius. Mortality and teacher attrition further shape workforce dynamics, leading to continuous recruitment of newcomers to maintain a stable population. The model tracks university reputation through the academic performance and number of alumni, and visualizes key metrics including teacher status distribution, school staffing, university alumni counts, and overall satisfaction. This structure enables the exploration of policy interventions, hiring and training strategies, and the impact of spatial and institutional design on the allocation, retention, and happiness of urban educational staff.
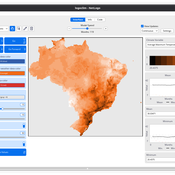
LogoClim: WorldClim in NetLogo
Daniel Vartanian Leandro Garcia Aline Martins de Carvalho Aline | Published Thursday, July 03, 2025 | Last modified Monday, July 13, 2026LogoClim is a NetLogo model designed to be integrated into other simulations through the LevelSpace extension (Hjorth et al., 2020), providing high resolution climate data from sources validated and used by the Intergovernmental Panel on Climate Change (IPCC).
The model simplifies and standardizes the integration of climate data into NetLogo, allowing researchers to focus their efforts on the model itself with the assurance of using reliable and widely recognized data. Although its main use is as a component of larger simulations, LogoClim also has its own graphical interface for monitoring and checking the datasets.
The climate data comes from the WorldClim 2.1 project (Fick & Hijmans, 2017), for which LogoClim works as an interface to NetLogo. The model supports all three WorldClim data series: (1) Historical Climate Data (1970 to 2000), with 12 monthly points for minimum, mean, and maximum temperature, precipitation, solar radiation, wind speed, vapor pressure, elevation, and bioclimatic variables; (2) Historical Monthly Weather Data (1951 to 2024), based on downscaling of CRU-TS-4.09, developed by the Climatic Research Unit at the University of East Anglia (Harris et al., 2020), with minimum and maximum temperature and total precipitation; and (3) Future Climate Data, based on downscaling climate projections derived from global climate models of the Coupled Model Intercomparison Project Phase 6 (CMIP6) (Eyring et al., 2016) for four future periods (2021 to 2040, 2041 to 2060, 2061 to 2080, and 2081 to 2100) and four scenarios based on the Shared Socioeconomic Pathways (SSPs 126, 245, 370, and 585), covering minimum and maximum temperature, total precipitation, and bioclimatic variables. All series are available at multiple spatial resolutions, from 10 minutes (about 340 km² at the equator) to 30 seconds (about 1 km² at the equator).
…
Peer reviewed ACross (Academic Collaboration, Research, Output, and System Simulation)
Wenhan Feng Bayi Li | Published Saturday, June 28, 2025The primary purpose of this model is to explain the dynamic processes within university-centered collaboration networks, with a particular focus on the complex transformation of academic knowledge into practical projects. Based on investigations of actual research projects and a thorough literature review, the model integrates multiple drivers and influencing factors to explore how these factors affect the formation and evolution of collaboration networks under different parameter scenarios. The model places special emphasis on the impact of disciplinary attributes, knowledge exchange, and interdisciplinary collaboration on the dynamics of collaboration networks, as well as the complex mechanisms of network structure, system efficiency, and interdisciplinary interactions during project formation.
Specifically, the model aims to:
- Simulate how university research departments drive the formation of research projects through knowledge creation.
- Investigate how the dynamics of collaboration networks influence the transformation of innovative hypotheses into matured projects.
- Examine the critical roles of knowledge exchange and interdisciplinary collaboration in knowledge production and project formation.
- Provide both quantitative and qualitative insights into the interactions among academia, industry, and project outputs.

Multi-Agent Socio-Ecological Hani Terrace Model
Lei Dong Yunnan University | Published Saturday, March 29, 2025This model is to explore the changes of paddy field landscape and household livelihood structure in the village under different policy scenarios, evaluate the eco-social effects of different policies, and provide decision support tools for proposing effective and feasible policies.

Peer reviewed Evolution of Conditional Cooperation in a Spatial Public Goods Game
Marco Janssen Francesca Federico Raksha Balakrishna | Published Saturday, March 15, 2025A model to investigate the Evolution of Conditional Cooperation in a Spatial Public Goods Game. We consider two conditional cooperation strategies: one based on thresholds (Battu & Srinivasan, 2020) and another based on independent decisions for each number of cooperating neighbors. We examine the effects of productivity and conditional cooperation criteria on the trajectory of cooperation. Cooperation is evolving with no need for additional mechanisms apart from spatial structure when agents follow conditional strategies. We confirm the positive influence of productivity and cluster formation on the evolution of cooperation in spatial models. Results are robust for the two types of conditional cooperation strategies.
Displaying 10 of 120 results structure clear search