Our mission is to help computational modelers develop, document, and share their computational models in accordance with community standards and good open science and software engineering practices. Model authors can publish their model source code in the Computational Model Library with narrative documentation as well as metadata that supports open science and emerging norms that facilitate software citation, computational reproducibility / frictionless reuse, and interoperability. Model authors can also request private peer review of their computational models. Models that pass peer review receive a DOI once published.
All users of models published in the library must cite model authors when they use and benefit from their code.
Please check out our model publishing tutorial and feel free to contact us if you have any questions or concerns about publishing your model(s) in the Computational Model Library.
Displaying 10 of 189 results for "Ed Manley" clear search
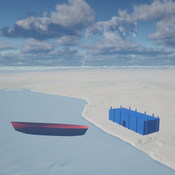
Seascapes of the Unreal: Using Agent Based Modeling to Examine Traditional Coast Salish Maritime Mobility
Adam Rorabaugh | Published Friday, December 22, 2023Non-traditional tools and mediums can provide unique methodological and interpretive opportunities for archaeologists. In this case, the Unreal Engine (UE), which is typically used for games and media, has provided a powerful tool for non-programmers to engage with 3D visualization and programming as never before. UE has a low cost of entry for researchers as it is free to download and has user-friendly “blueprint” tools that are visual and easily extendable. Traditional maritime mobility in the Salish Sea is examined using an agent-based model developed in blueprints. Focusing on the sea canoe travel of the Straits Salish northwestern Washington State and southwest British Columbia. This simulation integrates GIS data to assess travel time between Coast Salish archaeological village locations and archaeologically represented resource gathering areas. Transportation speeds informed by ethnographic data were used to examine travel times for short forays and longer inter-village journeys. The results found that short forays tended to half day to full day trips when accounting for resource gathering activities. Similarly, many locations in the Salish Sea were accessible in long journeys within two to three days, assuming fair travel conditions. While overall transportation costs to reach sites may be low, models such as these highlight the variability in transport risk and cost. The integration of these types of tools, traditionally used for entertainment, can increase the accessibility of modeling approaches to researchers, be expanded to digital storytelling, including aiding in the teaching of traditional ecological knowledge and placenames, and can have wide applications beyond maritime archaeology.
This is v0.01 of a UE5.2.1 agent based model.
Individual bias and organizational objectivity
Bo Xu | Published Monday, April 15, 2013 | Last modified Monday, April 08, 2019This model introduces individual bias to the model of exploration and exploitation, simulates knowledge diffusion within organizations, aiming to investigate the effect of individual bias and other related factors on organizational objectivity.

How to not get stuck – an ant model showing how negative feedback due to crowding maintains flexibility in ant foraging
Tomer Czaczkes | Published Thursday, December 17, 2015Positive feedback can lead to “trapping” in local optima. Adding a simple negative feedback effect, based on ant behaviour, prevents this trapping
Effective population size and cultural evolution
Luke Premo | Published Tuesday, May 17, 2016This model illustrates how the effective population size and the rate of change in mean skill level of a cultural trait are affected by the presence of natural selection and/or the cultural transmission mechanism by which it is passed.
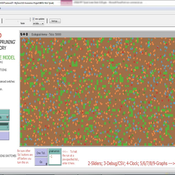
04 TpLab V2.08 – Teleological Pruning Laboratory
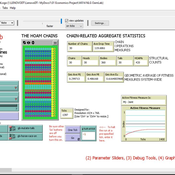
Garvin Boyle | Published Saturday, April 15, 2017Our societal belief systems are pruned by evolution, informing our unsustainable economies. This is one of a series of models exploring the dynamics of sustainable economics – PSoup, ModEco, EiLab, OamLab, MppLab, TpLab, CmLab.
CPNorm
Ruth Meyer | Published Sunday, June 04, 2017 | Last modified Tuesday, June 13, 2017CPNorm is a model of a community of harvesters using a common pool resource where adhering to the optimal extraction level has become a social norm. The model can be used to explore the robustness of norm-driven cooperation in the commons.
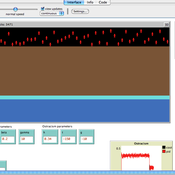
Netlogo Earned Value Management Model
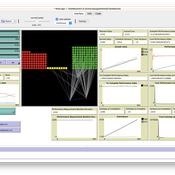
Manuel Castañón-Puga Ricardo Fernando Rosales–Cisneros Julio César Acosta–Prado Alfredo Tirado–Ramos Camilo Khatchikian Elías Aburto–Camacllanqui | Published Thursday, November 24, 2022The model aims to illustrate how Earned Value Management (EVM) provides an approach to measure a project’s performance by comparing its actual progress against the planned one, allowing it to evaluate trends to formulate forecasts. The instance performs a project execution and calculates the EVM performance indexes according to a Performance Measurement Baseline (PMB), which integrates the description of the work to do (scope), the deadlines for its execution (schedule), and the calculation of its costs and the resources required for its implementation (cost).
Specifically, we are addressing the following questions: How does the risk of execution delay or advance impact cost and schedule performance? How do the players’ number or individual work capacity impact cost and schedule estimations to finish? Regardless of why workers cause delays or produce overruns in their assignments, does EVM assess delivery performance and help make objective decisions?
To consider our model realistic enough for its purpose, we use the following patterns: The model addresses classic problems of Project Management (PM). It plays the typical task board where workers are assigned to complete a task backlog in project performance. Workers could delay or advance in the task execution, and we calculate the performance using the PMI-recommended Earned Value.
02 OamLab V1.10 - Open Atwood Machine Laboratory
Garvin Boyle | Published Saturday, January 31, 2015 | Last modified Thursday, April 13, 2017Using chains of replicas of Atwood’s Machine, this model explores implications of the Maximum Power Principle. It is one of a series of models exploring the dynamics of sustainable economics – PSoup, ModEco, EiLab, OamLab, MppLab, TpLab, EiLab.
03 MppLab V1.09 – Maximum Power Principle Laboratory
Garvin Boyle | Published Saturday, April 15, 2017Using webs of replicas of Atwood’s Machine, we explore implications of the Maximum Power Principle. This is one of a series of models exploring the dynamics of sustainable economics – PSoup, ModEco, EiLab, OamLab, MppLab, TpLab, CmLab.
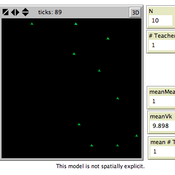
Peer reviewed Monogamous Reproduction in Small Populations and the Enforcement of the Incest Taboo
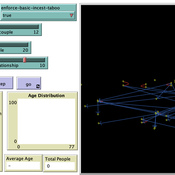
Ian Stuart | Published Wednesday, January 18, 2023This program was developed to simulate monogamous reproduction in small populations (and the enforcement of the incest taboo).
Every tick is a year. Adults can look for a mate and enter a relationship. Adult females in a Relationship (under the age of 52) have a chance to become pregnant. Everyone becomes not alive at 77 (at which point people are instead displayed as flowers).
User can select a starting-population. The starting population will be adults between the ages of 18 and 42.
…
Displaying 10 of 189 results for "Ed Manley" clear search