Our mission is to help computational modelers develop, document, and share their computational models in accordance with community standards and good open science and software engineering practices. Model authors can publish their model source code in the Computational Model Library with narrative documentation as well as metadata that supports open science and emerging norms that facilitate software citation, computational reproducibility / frictionless reuse, and interoperability. Model authors can also request private peer review of their computational models. Models that pass peer review receive a DOI once published.
All users of models published in the library must cite model authors when they use and benefit from their code.
Please check out our model publishing tutorial and feel free to contact us if you have any questions or concerns about publishing your model(s) in the Computational Model Library.
Displaying 10 of 823 results for "Jon Norberg" clear search
The Effects of Fiscal Targets in a Currency Union: a Multi-Country Agent Based-Stock Flow Consistent Model
Ermanno Catullo Alessandro Caiani Mauro Gallegati | Published Saturday, March 11, 2017We present an Agent-Based Stock Flow Consistent Multi-Country model of a Currency Union to analyze the impact of changes in the fiscal regimes that is permanent changes in the deficit-to-GDP targets that governments commit to comply.
Peer reviewed Collectivities
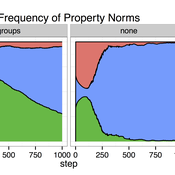
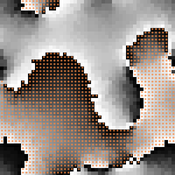
Nigel Gilbert | Published Tuesday, April 09, 2019 | Last modified Thursday, August 22, 2019The model that simulates the dynamic creation and maintenance of knowledge-based formations such as communities of scientists, fashion movements, and subcultures. The model’s environment is a spatial one, representing not geographical space, but a “knowledge space” in which each point is a different collection of knowledge elements. Agents moving through this space represent people’s differing and changing knowledge and beliefs. The agents have only very simple behaviors: If they are “lonely,” that is, far from a local concentration of agents, they move toward the crowd; if they are crowded, they move away.
Running the model shows that the initial uniform random distribution of agents separates into “clumps,” in which some agents are central and others are distributed around them. The central agents are crowded, and so move. In doing so, they shift the centroid of the clump slightly and may make other agents either crowded or lonely, and they too will move. Thus, the clump of agents, although remaining together for long durations (as measured in time steps), drifts across the view. Lonely agents move toward the clump, sometimes joining it and sometimes continuing to trail behind it. The clumps never merge.
The model is written in NetLogo (v6). It is used as a demonstration of agent-based modelling in Gilbert, N. (2008) Agent-Based Models (Quantitative Applications in the Social Sciences). Sage Publications, Inc. and described in detail in Gilbert, N. (2007) “A generic model of collectivities,” Cybernetics and Systems. European Meeting on Cybernetic Science and Systems Research, 38(7), pp. 695–706.
Peer reviewed AgModel
Isaac Ullah | Published Friday, December 06, 2024AgModel is an agent-based model of the forager-farmer transition. The model consists of a single software agent that, conceptually, can be thought of as a single hunter-gather community (i.e., a co-residential group that shares in subsistence activities and decision making). The agent has several characteristics, including a population of human foragers, intrinsic birth and death rates, an annual total energy need, and an available amount of foraging labor. The model assumes a central-place foraging strategy in a fixed territory for a two-resource economy: cereal grains and prey animals. The territory has a fixed number of patches, and a starting number of prey. While the model is not spatially explicit, it does assume some spatiality of resources by including search times.
Demographic and environmental components of the simulation occur and are updated at an annual temporal resolution, but foraging decisions are “event” based so that many such decisions will be made in each year. Thus, each new year, the foraging agent must undertake a series of optimal foraging decisions based on its current knowledge of the availability of cereals and prey animals. Other resources are not accounted for in the model directly, but can be assumed for by adjusting the total number of required annual energy intake that the foraging agent uses to calculate its cereal and prey animal foraging decisions. The agent proceeds to balance the net benefits of the chance of finding, processing, and consuming a prey animal, versus that of finding a cereal patch, and processing and consuming that cereal. These decisions continue until the annual kcal target is reached (balanced on the current human population). If the agent consumes all available resources in a given year, it may “starve”. Starvation will affect birth and death rates, as will foraging success, and so the population will increase or decrease according to a probabilistic function (perturbed by some stochasticity) and the agent’s foraging success or failure. The agent is also constrained by labor caps, set by the modeler at model initialization. If the agent expends its yearly budget of person-hours for hunting or foraging, then the agent can no longer do those activities that year, and it may starve.
Foragers choose to either expend their annual labor budget either hunting prey animals or harvesting cereal patches. If the agent chooses to harvest prey animals, they will expend energy searching for and processing prey animals. prey animals search times are density dependent, and the number of prey animals per encounter and handling times can be altered in the model parameterization (e.g. to increase the payoff per encounter). Prey animal populations are also subject to intrinsic birth and death rates with the addition of additional deaths caused by human predation. A small amount of prey animals may “migrate” into the territory each year. This prevents prey animals populations from complete decimation, but also may be used to model increased distances of logistic mobility (or, perhaps, even residential mobility within a larger territory).
…
Pedestrian model
Gudrun Wallentin Dana Kaziyeva Martin Loidl Petra Stutz | Published Monday, August 07, 2023The model generates disaggregated traffic flows of pedestrians, simulating their daily mobility behaviour represented as probabilistic rules. Various parameters of physical infrastructure and travel behaviour can be altered and tested. This allows predicting potential shifts in traffic dynamics in a simulated setting. Moreover, assumptions in decision-making processes are general for mid-sized cities and can be applied to similar areas.
Together with the model files, there is the ODD protocol with the detailed description of model’s structure. Check the associated publication for results and evaluation of the model.
Installation
Download GAMA-platform (GAMA1.8.2 with JDK version) from https://gama-platform.github.io/. The platform requires a minimum of 4 GB of RAM.
…
DARTS: an agent-based model of the global food system for studying its resilience to shocks
Hubert Fonteijn | Published Wednesday, November 22, 2023DARTS simulates food systems in which agents produce, consume and trade food. Here, food is a summary item that roughly corresponds to commodity food types (e.g. rice). No other food types are taken into account. Each food system (World) consists of its own distribution of agents, regions and connections between agents. Agents differ in their ability to produce food, earn off-farm income and trade food. The agents aim to satisfy their food requirements (which are fixed and equal across agents) by either their own food production or by food purchases. Each simulation step represents one month, in which agents can produce (if they have productive capacity and it is a harvest month for their region), earn off-farm income, trade food (both buy and sell) and consume food. We evaluate the performance of the food system by averaging the agents’ food satisfaction, which is defined as the ratio of the food consumed by each agent at the end of each month divided by her food requirement. At each step, any of the abovementioned attributes related to the agents’ ability to satisfy their food requirement can (temporarily) be shocked. These shocks include reducing the amount of food they produce, removing their ability to trade locally or internationally and reducing their cash savings. Food satisfaction is quantified (both immediately after the shock and in the year following the shock) to evaluate food security of a particular food system, both at the level of agent types (e.g. the urban poor and the rural poor) and at the systems level. Thus, the effects of shocks on food security can be related to the food system’s structure.
Market for Protection
Steven Doubleday | Published Monday, July 01, 2013 | Last modified Monday, August 19, 2013Simulation to replicate and extend an analytical model (Konrad & Skaperdas, 2010) of the provision of security as a collective good. We simulate bandits preying upon peasants in an anarchy condition.
Cultural Group Selection of Sustainable Institutions
Timothy Waring Paul Smaldino Sandra H Goff | Published Wednesday, June 10, 2015 | Last modified Tuesday, August 04, 2015We develop a spatial, evolutionary model of the endogenous formation and dissolution of groups using a renewable common pool resource. We use this foundation to measure the evolutionary pressures at different organizational levels.
Segregation and Opinion Polarization
Thomas Feliciani Andreas Flache Jochem Tolsma | Published Wednesday, April 13, 2016This is a tool to explore the effects of groups´ spatial segregation on the emergence of opinion polarization. It embeds two opinion formation models: a model of negative (and positive) social influence and a model of persuasive argument exchange.
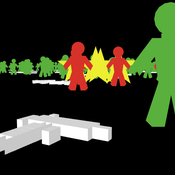
Peer reviewed NetLogo model of USA mass shootings
Smarzhevskiy Ivan | Published Tuesday, September 24, 2019 | Last modified Tuesday, April 14, 2020Is the mass shooter a maniac or a relatively normal person in a state of great stress? According to the FBI report (Silver, J., Simons, A., & Craun, S. (2018). A Study of the Pre-Attack Behaviors of Active Shooters in the United States Between 2000 – 2013. Federal Bureau of Investigation, U.S. Department of Justice,Washington, D.C. 20535.), only 25% of the active shooters were known to have been diagnosed by a mental health professional with a mental illness of any kind prior to the offense.
The main objects of the model are the humans and the guns. The main factors influencing behavior are the population size, the number of people with mental disabilities (“psycho” in the model terminology) per 100,000 population, the total number of weapons (“guns”) in the population, the availability of guns for humans, the intensity of stressors affecting humans and the threshold level of stress, upon reaching which a person commits an act of mass shooting.
The key difference (in the model) between a normal person and a psycho is that a psycho accumulates stressors and, upon reaching a threshold level, commits an act of mass shooting. A normal person is exposed to stressors, but reaching the threshold level for killing occurs only when the simultaneous effect of stressors on him exceeds this level.
The population dynamics are determined by the following factors: average (normally distributed) life expectancy (“life_span” attribute of humans) and population growth with the percentage of newborns set by the value of the TickReprRatio% slider of the current population volume from 16 to 45 years old.Thus, one step of model time corresponds to a year.
RecovUS: An Agent-Based Model of Post-Disaster Household Recovery
Saeed Moradi | Published Thursday, July 30, 2020The purpose of this model is to explain the post-disaster recovery of households residing in their own single-family homes and to predict households’ recovery decisions from drivers of recovery. Herein, a household’s recovery decision is repair/reconstruction of its damaged house to the pre-disaster condition, waiting without repair/reconstruction, or selling the house (and relocating). Recovery drivers include financial conditions and functionality of the community that is most important to a household. Financial conditions are evaluated by two categories of variables: costs and resources. Costs include repair/reconstruction costs and rent of another property when the primary house is uninhabitable. Resources comprise the money required to cover the costs of repair/reconstruction and to pay the rent (if required). The repair/reconstruction resources include settlement from the National Flood Insurance (NFI), Housing Assistance provided by the Federal Emergency Management Agency (FEMA-HA), disaster loan offered by the Small Business Administration (SBA loan), a share of household liquid assets, and Community Development Block Grant Disaster Recovery (CDBG-DR) fund provided by the Department of Housing and Urban Development (HUD). Further, household income determines the amount of rent that it can afford. Community conditions are assessed for each household based on the restoration of specific anchors. ASNA indexes (Nejat, Moradi, & Ghosh 2019) are used to identify the category of community anchors that is important to a recovery decision of each household. Accordingly, households are indexed into three classes for each of which recovery of infrastructure, neighbors, or community assets matters most. Further, among similar anchors, those anchors are important to a household that are located in its perceived neighborhood area (Moradi, Nejat, Hu, & Ghosh 2020).
Displaying 10 of 823 results for "Jon Norberg" clear search