Our mission is to help computational modelers develop, document, and share their computational models in accordance with community standards and good open science and software engineering practices. Model authors can publish their model source code in the Computational Model Library with narrative documentation as well as metadata that supports open science and emerging norms that facilitate software citation, computational reproducibility / frictionless reuse, and interoperability. Model authors can also request private peer review of their computational models. Models that pass peer review receive a DOI once published.
All users of models published in the library must cite model authors when they use and benefit from their code.
Please check out our model publishing tutorial and feel free to contact us if you have any questions or concerns about publishing your model(s) in the Computational Model Library.
Displaying 10 of 15 results insurance clear search
FRAMe (Flood Resilience Agent-Based Model)
Wenhan Feng | Published Wednesday, October 22, 2025The FRAMe (Flood Resilience Agent-Based Model) serves as a framework designed to simulate flood resilience dynamics at the community level, focusing on a rural settlement in the Mekong River Basin. Integrating empirical data from extensive surveys, Bayesian networks, and hydrological simulations, the framework quantifies resilience as a trade-off between robustness (resistance to damage) and adaptability (capacity for dynamic response). Agents include households, governments, and other actors, linked by social and governance networks that facilitate knowledge transfer, resource distribution, and risk communication. FRAMe incorporates mechanisms for flood forecasting, policy interventions (education, aid, insurance), and individual and collective decision-making, grounded in Protection Motivation Theory and MoHuB frameworks. The framework’s spatially explicit design leverages GIS data, which supports scenario testing of governance structures and stakeholder interactions. By examining policy scenarios and agent behavior, FRAMe aims to inform adaptive flood management strategies and enhance community resilience.
A replication and extension of the Taylor's Simulation Model of Insurance Market Dynamics in C#
Rei England | Published Sunday, September 24, 2023A simple model is constructed using C# in order to to capture key features of market dynamics, while also producing reasonable results for the individual insurers. A replication of Taylor’s model is also constructed in order to compare results with the new premium setting mechanism. To enable the comparison of the two premium mechanisms, the rest of the model set-up is maintained as in the Taylor model. As in the Taylor example, homogeneous customers represented as a total market exposure which is allocated amongst the insurers.
In each time period, the model undergoes the following steps:
1. Insurers set competitive premiums per exposure unit
2. Losses are generated based on each insurer’s share of the market exposure
3. Accounting results are calculated for each insurer
…
An Agent-Based Model of an Insurance Market driven by Supply and Demand with Imperfectly Estimated Strategies in C#
Rei England | Published Sunday, September 24, 2023This is a simulation of an insurance market where the premium moves according to the balance between supply and demand. In this model, insurers set their supply with the aim of maximising their expected utility gain while operating under imperfect information about both customer demand and underlying risk distributions.
There are seven types of insurer strategies. One type follows a rational strategy within the bounds of imperfect information. The other six types also seek to maximise their utility gain, but base their market expectations on a chartist strategy. Under this strategy, market premium is extrapolated from trends based on past insurance prices. This is subdivided according to whether the insurer is trend following or a contrarian (counter-trend), and further depending on whether the trend is estimated from short-term, medium-term, or long-term data.
Customers are modelled as a whole and allocated between insurers according to available supply. Customer demand is calculated according to a logit choice model based on the expected utility gain of purchasing insurance for an average customer versus the expected utility gain of non-purchase.
An Agent-Based Model of an Insurer's Estimated Capital Requirement in a Simple Insurance Market with Imperfect Information in C#
Rei England | Published Sunday, September 24, 2023This is an agent-based model of a simple insurance market with two types of agents: customers and insurers. Insurers set premium quotes for each customer according to an estimation of their underlying risk based on past claims data. Customers either renew existing contracts or else select the cheapest quote from a subset of insurers. Insurers then estimate their resulting capital requirement based on a 99.5% VaR of their aggregate loss distributions. These estimates demonstrate an under-estimation bias due to the winner’s curse effect.
An Agent-Based Model of Insurance Customer Behaviour with Word of Mouth Network in C#
Rei England Iqbal Owadally Douglas Wright | Published Friday, March 04, 2022This is an agent-based model with two types of agents: customers and insurers. Insurers are price-takers who choose how much to spend on their service quality, and customers evaluate insurers based on premium, brand preference, and their perceived service quality. Customers are also connected in a small-world network and may share their opinions with their network.
The ABM contains two types of agents: insurers and customers. These act within the environment of a motor insurance market. At each simulation, the model undergoes the following steps:
- Network generation: At the start of the simulation, the model generates a small world network of social links between the customers, and randomly assigns each customer to an initial insurer ...
Risk-Sharing under Heterogeneity: NetLogo simulation
Eva Vriens | Published Monday, February 28, 2022Motivated by the emergence of new Peer-to-Peer insurance organizations that rethink how insurance is organized, we propose a theoretical model of decision-making in risk-sharing arrangements with risk heterogeneity and incomplete information about the risk distribution as core features. For these new, informal organisations, the available institutional solutions to heterogeneity (e.g., mandatory participation or price differentiation) are either impossible or undesirable. Hence, we need to understand the scope conditions under which individuals are motivated to participate in a bottom-up risk-sharing setting. The model puts forward participation as a utility maximizing alternative for agents with higher risk levels, who are more risk averse, are driven more by solidarity motives, and less susceptible to cost fluctuations. This basic micro-level model is used to simulate decision-making for agent populations in a dynamic, interdependent setting. Simulation results show that successful risk-sharing arrangements may work if participants are driven by motivations of solidarity or risk aversion, but this is less likely in populations more heterogeneous in risk, as the individual motivations can less often make up for the larger cost deficiencies. At the same time, more heterogeneous groups deal better with uncertainty and temporary cost fluctuations than more homogeneous populations do. In the latter, cascades following temporary peaks in support requests more often result in complete failure, while under full information about the risk distribution this would not have happened.
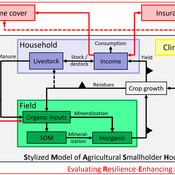
SMASH: Stylized Model of Agricultural Smallholder Households
Tim Williams | Published Tuesday, December 08, 2020The SMASH model is an agent-based model of rural smallholder households. It models households’ evolving income and wealth, which they earn through crop sales. Wealth is carried in the form of livestock, which are grazed on an external rangeland (exogenous) and can be bought/sold as investment/coping mechanisms. The model includes a stylized representation of soil nutrient dynamics, modeling the inflows and outflows of organic and inorganic nitrogen from each household’s field.
The model has been applied to assess the resilience-enhancing effects of two different farm-level adaptation strategies: legume cover cropping and crop insurance. These two strategies interact with the model through different mechanims - legume cover cropping through ecological mechanisms and crop insurance through financial mechanisms. The model can be used to investigate the short- and long-term effects of these strategies, as well as how they may differently benefit different types of household.
RecovUS: An Agent-Based Model of Post-Disaster Household Recovery
Saeed Moradi | Published Thursday, July 30, 2020The purpose of this model is to explain the post-disaster recovery of households residing in their own single-family homes and to predict households’ recovery decisions from drivers of recovery. Herein, a household’s recovery decision is repair/reconstruction of its damaged house to the pre-disaster condition, waiting without repair/reconstruction, or selling the house (and relocating). Recovery drivers include financial conditions and functionality of the community that is most important to a household. Financial conditions are evaluated by two categories of variables: costs and resources. Costs include repair/reconstruction costs and rent of another property when the primary house is uninhabitable. Resources comprise the money required to cover the costs of repair/reconstruction and to pay the rent (if required). The repair/reconstruction resources include settlement from the National Flood Insurance (NFI), Housing Assistance provided by the Federal Emergency Management Agency (FEMA-HA), disaster loan offered by the Small Business Administration (SBA loan), a share of household liquid assets, and Community Development Block Grant Disaster Recovery (CDBG-DR) fund provided by the Department of Housing and Urban Development (HUD). Further, household income determines the amount of rent that it can afford. Community conditions are assessed for each household based on the restoration of specific anchors. ASNA indexes (Nejat, Moradi, & Ghosh 2019) are used to identify the category of community anchors that is important to a recovery decision of each household. Accordingly, households are indexed into three classes for each of which recovery of infrastructure, neighbors, or community assets matters most. Further, among similar anchors, those anchors are important to a household that are located in its perceived neighborhood area (Moradi, Nejat, Hu, & Ghosh 2020).
RiskNetABM
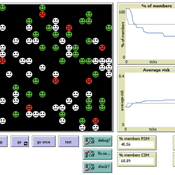
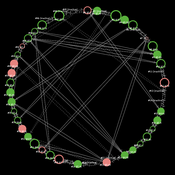
Birgit Müller Jürgen Groeneveld Karin Frank Meike Will Friederike Lenel | Published Monday, July 20, 2020 | Last modified Monday, May 03, 2021The fight against poverty is an urgent global challenge. Microinsurance is promoted as a valuable instrument for buffering income losses due to health or climate-related risks of low-income households in developing countries. However, apart from direct positive effects they can have unintended side effects when insured households lower their contribution to traditional arrangements where risk is shared through private monetary support.
RiskNetABM is an agent-based model that captures dynamics between income losses, insurance payments and informal risk-sharing. The model explicitly includes decisions about informal transfers. It can be used to assess the impact of insurance products and informal risk-sharing arrangements on the resilience of smallholders. Specifically, it allows to analyze whether and how economic needs (i.e. level of living costs) and characteristics of extreme events (i.e. frequency, intensity and type of shock) influence the ability of insurance and informal risk-sharing to buffer income shocks. Two types of behavior with regard to private monetary transfers are explicitly distinguished: (1) all households provide transfers whenever they can afford it and (2) insured households do not show solidarity with their uninsured peers.
The model is stylized and is not used to analyze a particular case study, but represents conditions from several regions with different risk contexts where informal risk-sharing networks between smallholder farmers are prevalent.
…
Coupled Housing and Land Markets (CHALMS)
Nicholas Magliocca | Published Thursday, August 29, 2019An economic agent-based model of Coupled Housing and Land Markets (CHALMS) simulates the location choices, insurance purchasing decisions, and risk perceptions of coastal residents, and how coastal risks are capitalized (or not) into coastal housing and land markets.
Displaying 10 of 15 results insurance clear search