About the CoMSES Model Library more info
Our mission is to help computational modelers develop, document, and share their computational models in accordance with community standards and good open science and software engineering practices. Model authors can publish their model source code in the Computational Model Library with narrative documentation as well as metadata that supports open science and emerging norms that facilitate software citation, computational reproducibility / frictionless reuse, and interoperability. Model authors can also request private peer review of their computational models. Models that pass peer review receive a DOI once published.
All users of models published in the library must cite model authors when they use and benefit from their code.
Please check out our model publishing tutorial and feel free to contact us if you have any questions or concerns about publishing your model(s) in the Computational Model Library.
We also maintain a curated database of over 7500 publications of agent-based and individual based models with detailed metadata on availability of code and bibliometric information on the landscape of ABM/IBM publications that we welcome you to explore.
Displaying 10 of 72 results for "Guillaume Arnoux H%C3%A9bert" clear search
Socio-hydrologicalModel_version_SESMO
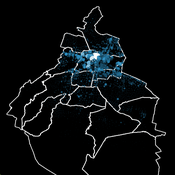
Marco Janssen Andres Baeza-Castro Paola Gomez Luis Bojorquez Fidel Serrano-Candela Hallie Eakin Yosune Miquelajauregui Rodrigo Garcia-Herrera | Published Tuesday, February 05, 2019We present here MEGADAPT_SESMO model. A hybrid, dynamic, spatially explicit, integrated model to simulate the vulnerability of urban coupled socio-ecological systems – in our case, the vulnerability of Mexico City to socio-hydrological risk.
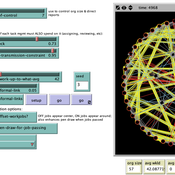
Formal Organization Hierarchy and Informal Networks - "The Company Behind the Org Chart"
Tom Briggs | Published Sunday, April 18, 2021A generalized organizational agent- based model (ABM) containing both formal organizational hierarchy and informal social networks simulates organizational processes that occur over both formal network ties and informal networks.
Forager mobility and interaction
L S Premo | Published Thursday, January 10, 2013 | Last modified Saturday, April 27, 2013This is a relatively simple foraging-radius model, as described first by Robert Kelly, that allows one to quantify the effect of increased logistical mobility (as represented by increased effective foraging radius, r_e) on the likelihood that 2 randomly placed central place foragers will encounter one another within 5000 time steps.
Peer reviewed SIM-VOLATILE: Adoption of emerging circular technologies in the waste-treatment sector
Siavash Farahbakhsh | Published Wednesday, December 14, 2022The SIM-VOLATILE model is a technology adoption model at the population level. The technology, in this model, is called Volatile Fatty Acid Platform (VFAP) and it is in the frame of the circular economy. The technology is considered an emerging technology and it is in the optimization phase. Through the adoption of VFAP, waste-treatment plants will be able to convert organic waste into high-end products rather than focusing on the production of biogas. Moreover, there are three adoption/investment scenarios as the technology enables the production of polyhydroxyalkanoates (PHA), single-cell oils (SCO), and polyunsaturated fatty acids (PUFA). However, due to differences in the processing related to the products, waste-treatment plants need to choose one adoption scenario.
In this simulation, there are several parameters and variables. Agents are heterogeneous waste-treatment plants that face the problem of circular economy technology adoption. Since the technology is emerging, the adoption decision is associated with high risks. In this regard, first, agents evaluate the economic feasibility of the emerging technology for each product (investment scenarios). Second, they will check on the trend of adoption in their social environment (i.e. local pressure for each scenario). Third, they combine these two economic and social assessments with an environmental assessment which is their environmental decision-value (i.e. their status on green technology). This combination gives the agent an overall adaptability fitness value (detailed for each scenario). If this value is above a certain threshold, agents may decide to adopt the emerging technology, which is ultimately depending on their predominant adoption probabilities and market gaps.

Peer reviewed Descriptive Norm and Fraud Dynamics
Alexandra Eckert Matthias Meyer Christian Stindt | Published Tuesday, January 07, 2025The “Descriptive Norm and Fraud Dynamics” model demonstrates how fraudulent behavior can either proliferate or be contained within non-hierarchical organizations, such as peer networks, through social influence taking the form of a descriptive norm. This model expands on the fraud triangle theory, which posits that an individual must concurrently possess a financial motive, perceive an opportunity, and hold a pro-fraud attitude to engage in fraudulent activities (red agent). In the absence of any of these elements, the individual will act honestly (green agent).
The model explores variations in a descriptive norm mechanism, ranging from local distorted knowledge to global perfect knowledge. In the case of local distorted knowledge, agents primarily rely on information from their first-degree colleagues. This knowledge is often distorted because agents are slow to update their empirical expectations, which are only partially revised after one-to-one interactions. On the other end of the spectrum, local perfect knowledge is achieved by incorporating a secondary source of information into the agents’ decision-making process. Here, accurate information provided by an observer is used to update empirical expectations.
The model shows that the same variation of the descriptive norm mechanism could lead to varying aggregate fraud levels across different fraud categories. Two empirically measured norm sensitivity distributions associated with different fraud categories can be selected into the model to see the different aggregate outcomes.
Peer reviewed MOOvPOPsurveillance
Matthew Gompper Aniruddha Belsare Joshua J Millspaugh | Published Tuesday, April 04, 2017 | Last modified Tuesday, May 12, 2020MOOvPOPsurveillance was developed as a tool for wildlife agencies to guide collection and analysis of disease surveillance data that relies on non-probabilistic methods like harvest-based sampling.
Artificial Long House Valley-Black Mesa
Lisa Sattenspiel Amy Warren | Published Thursday, March 19, 2020This model is an extension of the Artificial Long House Valley (ALHV) model developed by the authors (Swedlund et al. 2016; Warren and Sattenspiel 2020). The ALHV model simulates the population dynamics of individuals within the Long House Valley of Arizona from AD 800 to 1350. Individuals are aggregated into households that participate in annual agricultural and demographic cycles. The present version of the model incorporates features of the ALHV model including realistic age-specific fertility and mortality and, in addition, it adds the Black Mesa environment and population, as well as additional methods to allow migration between the two regions.
As is the case for previous versions of the ALHV model as well as the Artificial Anasazi (AA) model from which the ALHV model was derived (Axtell et al. 2002; Janssen 2009), this version makes use of detailed archaeological and paleoenvironmental data from the Long House Valley and the adjacent areas in Arizona. It also uses the same methods as the original AA model to estimate annual maize productivity of various agricultural zones within the Long House Valley. A new environment and associated methods have been developed for Black Mesa. Productivity estimates from both regions are used to determine suitable locations for households and farms during each year of the simulation.
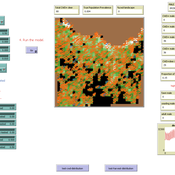
Peer reviewed SequiaBasalto model
Marco Janssen Irene Perez Ibarra Pierre Bommel Diego J. Soler-Navarro Alicia Tenza Peral Francisco Dieguez Cameroni | Published Friday, May 26, 2023This is a replication of the SequiaBasalto model, originally built in Cormas by Dieguez Cameroni et al. (2012, 2014, Bommel et al. 2014 and Morales et al. 2015). The model aimed to test various adaptations of livestock producers to the drought phenomenon provoked by climate change. For that purpose, it simulates the behavior of one livestock farm in the Basaltic Region of Uruguay. The model incorporates the price of livestock, fodder and paddocks, as well as the growth of grass as a function of climate and seasons (environmental submodel), the life cycle of animals feeding on the pasture (livestock submodel), and the different strategies used by farmers to manage their livestock (management submodel). The purpose of the model is to analyze to what degree the common management practices used by farmers (i.e., proactive and reactive) to cope with seasonal and interannual climate variations allow to maintain a sustainable livestock production without depleting the natural resources (i.e., pasture). Here, we replicate the environmental and livestock submodel using NetLogo.
One year is 368 days. Seasons change every 92 days. Each day begins with the growth of grass as a function of climate and season. This is followed by updating the live weight of cows according to the grass height of their patch, and grass consumption, which is determined based on the updated live weight. After consumption, cows grow and reproduce, and a new grass height is calculated. Cows then move to the patch with less cows and with the highest grass height. This updated grass height value will be the initial grass height for the next day.
This model extends the original Artifical Anasazi (AA) model to include individual agents, who vary in age and sex, and are aggregated into households. This allows more realistic simulations of population dynamics within the Long House Valley of Arizona from AD 800 to 1350 than are possible in the original model. The parts of this model that are directly derived from the AA model are based on Janssen’s 1999 Netlogo implementation of the model; the code for all extensions and adaptations in the model described here (the Artificial Long House Valley (ALHV) model) have been written by the authors. The AA model included only ideal and homogeneous “individuals” who do not participate in the population processes (e.g., birth and death)–these processes were assumed to act on entire households only. The ALHV model incorporates actual individual agents and all demographic processes affect these individuals. Individuals are aggregated into households that participate in annual agricultural and demographic cycles. Thus, the ALHV model is a combination of individual processes (birth and death) and household-level processes (e.g., finding suitable agriculture plots).
As is the case for the AA model, the ALHV model makes use of detailed archaeological and paleoenvironmental data from the Long House Valley and the adjacent areas in Arizona. It also uses the same methods as the original model (from Janssen’s Netlogo implementation) to estimate annual maize productivity of various agricultural zones within the valley. These estimates are used to determine suitable locations for households and farms during each year of the simulation.
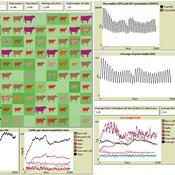
Peer reviewed soslivestock model
Marco Janssen Irene Perez Ibarra Diego J. Soler-Navarro Alicia Tenza Peral | Published Wednesday, May 28, 2025 | Last modified Tuesday, June 10, 2025The purpose of this model is to analyze how different management strategies affect the wellbeing, sustainability and resilience of an extensive livestock system under scenarios of climate change and landscape configurations. For this purpose, it simulates one cattle farming system, in which agents (cattle) move through the space using resources (grass). Three farmer profiles are considered: 1) a subsistence farmer that emphasizes self-sufficiency and low costs with limited attention to herd management practices, 2) a commercial farmer focused on profit maximization through efficient production methods, and 3) an environmental farmer that prioritizes conservation of natural resources and animal welfare over profit maximization. These three farmer profiles share the same management strategies to adapt to climate and resource conditions, but differ in their goals and decision-making criteria for when, how, and whether to implement those strategies. This model is based on the SequiaBasalto model (Dieguez Cameroni et al. 2012, 2014, Bommel et al. 2014 and Morales et al. 2015), replicated in NetLogo by Soler-Navarro et al. (2023).
One year is 368 days. Seasons change every 92 days. Each step begins with the growth of grass as a function of climate and season. This is followed by updating the live weight of animals according to the grass height of their patch, and grass consumption, which is determined based on the updated live weight. Animals can be supplemented by the farmer in case of severe drought. After consumption, cows grow and reproduce, and a new grass height is calculated. This updated grass height value becomes the starting grass height for the next day. Cows then move to the next area with the highest grass height. After that, cattle prices are updated and cattle sales are held on the first day of fall. In the event of a severe drought, special sales are held. Finally, at the end of the day, the farm balance and the farmer’s effort are calculated.
Displaying 10 of 72 results for "Guillaume Arnoux H%C3%A9bert" clear search