About the CoMSES Model Library more info
Our mission is to help computational modelers at all levels engage in the establishment and adoption of community standards and good practices for developing and sharing computational models. Model authors can freely publish their model source code in the Computational Model Library alongside narrative documentation, open science metadata, and other emerging open science norms that facilitate software citation, reproducibility, interoperability, and reuse. Model authors can also request peer review of their computational models to receive a DOI.
All users of models published in the library must cite model authors when they use and benefit from their code.
Please check out our model publishing tutorial and contact us if you have any questions or concerns about publishing your model(s) in the Computational Model Library.
We also maintain a curated database of over 7500 publications of agent-based and individual based models with additional detailed metadata on availability of code and bibliometric information on the landscape of ABM/IBM publications that we welcome you to explore.
Displaying 10 of 10 results animals clear
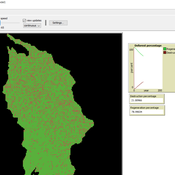
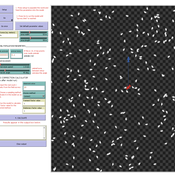
Deforest
Mohammad Aghajani | Published Saturday, January 20, 2024 | Last modified Saturday, January 20, 2024Deforest with GIS layers
This model has developed in Netlogo software and utilizes
the GIS extension.
It simulates deforestation with parameters such as the number of animals,
percentage of cut wood ,forest regeneration percentage ,
…
Peer reviewed Correlated Random Walk (NetLogo)
Viktoriia Radchuk Thibault Fronville Uta Berger | Published Tuesday, May 09, 2023 | Last modified Monday, December 18, 2023This is NetLogo code that presents two alternative implementations of Correlated Random Walk (CRW):
- 1. drawing the turning angles from the uniform distribution, i.e. drawing the angle with the same probability from a certain given range;
- 2. drawing the turning angles from von Mises distribution.
The move lengths are drawn from the lognormal distribution with the specified parameters.
Correlated Random Walk is used to represent the movement of animal individuals in two-dimensional space. When modeled as CRW, the direction of movement at any time step is correlated with the direction of movement at the previous time step. Although originally used to describe the movement of insects, CRW was later shown to sufficiently well describe the empirical movement data of other animals, such as wild boars, caribous, sea stars.
…
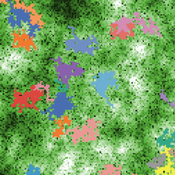
Animal territory formation (Reusable Building Block RBB)
Robert Zakrzewski Stephanie Kramer-Schadt Volker Grimm | Published Sunday, November 12, 2023This is a generic sub-model of animal territory formation. It is meant to be a reusable building block, but not in the plug-and-play sense, as amendments are likely to be needed depending on the species and region. The sub-model comprises a grid of cells, reprenting the landscape. Each cell has a “quality” value, which quantifies the amount of resources provided for a territory owner, for example a tiger. “Quality” could be prey density, shelter, or just space. Animals are located randomly in the landscape and add grid cells to their intial cell until the sum of the quality of all their cells meets their needs. If a potential new cell to be added is owned by another animal, competition takes place. The quality values are static, and the model does not include demography, i.e. mortality, mating, reproduction. Also, movement within a territory is not represented.
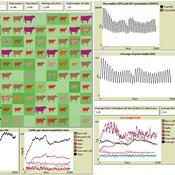
Peer reviewed SequiaBasalto model
Diego Soler Alicia Tenza Francisco Dieguez Cameroni Pierre Bommel Marco Janssen Irene Perez Ibarra | Published Friday, May 26, 2023This is a replication of the SequiaBasalto model, originally built in Cormas by Dieguez Cameroni et al. (2012, 2014, Bommel et al. 2014 and Morales et al. 2015). The model aimed to test various adaptations of livestock producers to the drought phenomenon provoked by climate change. For that purpose, it simulates the behavior of one livestock farm in the Basaltic Region of Uruguay. The model incorporates the price of livestock, fodder and paddocks, as well as the growth of grass as a function of climate and seasons (environmental submodel), the life cycle of animals feeding on the pasture (livestock submodel), and the different strategies used by farmers to manage their livestock (management submodel). The purpose of the model is to analyze to what degree the common management practices used by farmers (i.e., proactive and reactive) to cope with seasonal and interannual climate variations allow to maintain a sustainable livestock production without depleting the natural resources (i.e., pasture). Here, we replicate the environmental and livestock submodel using NetLogo.
One year is 368 days. Seasons change every 92 days. Each day begins with the growth of grass as a function of climate and season. This is followed by updating the live weight of cows according to the grass height of their patch, and grass consumption, which is determined based on the updated live weight. After consumption, cows grow and reproduce, and a new grass height is calculated. Cows then move to the patch with less cows and with the highest grass height. This updated grass height value will be the initial grass height for the next day.
Peer reviewed Lethal Geometry
Kristin Crouse | Published Friday, February 21, 2020 | Last modified Wednesday, December 15, 2021LethalGeometry was developed to examine whether territory size influences the mortality risk for individuals within that territory. For animals who live in territoral groups and are lethally aggressive, we can expect that most aggression occurs along the periphery (or border) between two adjacent territories. For territories that are relatively large, the periphery makes up a proportionately small amount of the of the total territory size, suggesting that individuals in these territories might be less likely to die from these territorial skirmishes. LethalGeometry examines this geometric relationship between territory size and mortality risk under realistic assumptions of variable territory size and shape, variable border width, and stochastic interactions and movement.
The individuals (agents) are programmed to walk randomly about their environment, search for and eat food to obtain energy, reproduce if they can, and act aggressively toward individuals of other groups. During each simulation step, individuals analyze their environment and internal state to determine which actions to take. The actions available to individuals include moving, fighting, and giving birth.
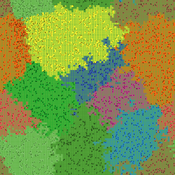
Change and Senescence
André Martins | Published Tuesday, November 10, 2020Agers and non-agers agent compete over a spatial landscape. When two agents occupy the same grid, who will survive is decided by a random draw where chances of survival are proportional to fitness. Agents have offspring each time step who are born at a distance b from the parent agent and the offpring inherits their genetic fitness plus a random term. Genetic fitness decreases with time, representing environmental change but effective non-inheritable fitness can increase as animals learn and get bigger.
AnimDens NetLogo
Miguel Pais Christine Ward-Paige | Published Friday, February 10, 2017 | Last modified Sunday, February 23, 2020The model demonstrates how non-instantaneous sampling techniques produce bias by overestimating the number of counted animals, when they move relative to the person counting them.
Livestock drought insurance model
Felix John Birgit Müller Russell Toth Karin Frank Jürgen Groeneveld | Published Tuesday, December 19, 2017 | Last modified Saturday, April 14, 2018The model analyzes the economic and ecological effects of a provision of livestock drought insurance for dryland pastoralists. More precisely, it yields qualitative insights into how long-term herd and pasture dynamics change through insurance.
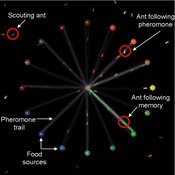
Composite Collective Decision Making - ant colony foraging model
Tomer Czaczkes Benjamin I Czaczkes | Published Thursday, December 17, 2015The model explores how two types of information - social (in the form of pheromone trails) and private (in the form of route memories) affect ant colony level foraging in a variable enviroment.
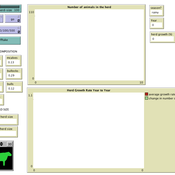
Peer reviewed Family Herd Demography
Abigail Buffington Andrew Yoak Ian M Hamilton Rebecca Garabed Mark Moritz | Published Monday, August 15, 2016 | Last modified Saturday, January 06, 2018The model examines the dynamics of herd growth in African pastoral systems. We used it to examine the role of scale (herd size) stochasticity (in mortality, fertility, and offtake) on herd growth.