Our mission is to help computational modelers develop, document, and share their computational models in accordance with community standards and good open science and software engineering practices. Model authors can publish their model source code in the Computational Model Library with narrative documentation as well as metadata that supports open science and emerging norms that facilitate software citation, computational reproducibility / frictionless reuse, and interoperability. Model authors can also request private peer review of their computational models. Models that pass peer review receive a DOI once published.
All users of models published in the library must cite model authors when they use and benefit from their code.
Please check out our model publishing tutorial and feel free to contact us if you have any questions or concerns about publishing your model(s) in the Computational Model Library.
Displaying 10 of 214 results for "David Nortes-Martinez" clear search
Pedestrian model
Gudrun Wallentin Dana Kaziyeva Martin Loidl Petra Stutz | Published Monday, August 07, 2023The model generates disaggregated traffic flows of pedestrians, simulating their daily mobility behaviour represented as probabilistic rules. Various parameters of physical infrastructure and travel behaviour can be altered and tested. This allows predicting potential shifts in traffic dynamics in a simulated setting. Moreover, assumptions in decision-making processes are general for mid-sized cities and can be applied to similar areas.
Together with the model files, there is the ODD protocol with the detailed description of model’s structure. Check the associated publication for results and evaluation of the model.
Installation
Download GAMA-platform (GAMA1.8.2 with JDK version) from https://gama-platform.github.io/. The platform requires a minimum of 4 GB of RAM.
…
PSMED - Patagonia Simple Model of Ethnic Differentiation
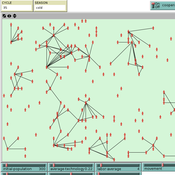
Xavier Vilà Joan A Barceló J A Cuesta Florencia Del Castillo Ricardo Del Olmo José M Galán Laura Mameli Francisco J Miguel David Poza José I Santos | Published Tuesday, December 10, 2013Patagonia PSMED is an agent-based model designed to study a simple case of Evolution of Ethnic Differentiation. It replicates how can hunter-gatherer societies evolve and built cultural identities as a consequence of the way they interacted.
Peer reviewed The OctoPINTS Model: Compliance and periodic fisheries closures (Beta)
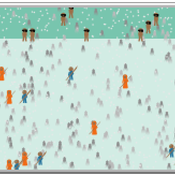
Emilie Lindkvist Maja Schlüter Tim M Daw Elizabeth Drury O'Neill Benedetta Veneroni Jineth Berrío-Martínez | Published Wednesday, April 20, 2022The purpose of the model is to explore how processes associated with compliance across different fishery actors’ social groups interplay with their acceptance of a fishery intervention, herein periodic closures of a small-scale octopus fishery. The model agents, entities and processes are designed based on stylized facts from literature and expert workshops on periodic closures in the Western Indian Ocean region, as well as fieldwork from Zanzibari villages that have implemented periodic octopus closures. The model is designed for scientists and decision-makers that are interested in understanding the complex interplay between fishers from different social groups, herein foot fisher men, foot fisher women and male skin divers or free divers within the periodic closure of an octopus species. Including various actions resulting from the restrictions, that is - opportunities that may be presented from restricting fishing in certain areas and during certain times. We are soon publishing an updated model with individual octopuses and their movement behaviors.
Knowledge Based Economy
Guido Fioretti Sirio Capizzi Ruggero Rossi Martina Casari Ala Jlif | Published Tuesday, May 18, 2021Knowledge Based Economy (KBE) is an artificial economy where firms placed in geographical space develop original knowledge, imitate one another and eventually recombine pieces of knowledge. In KBE, consumer value arises from the capability of certain pieces of knowledge to bridge between existing items (e.g., Steve Jobs illustrated the first smartphone explaining that you could make a call with it, but also listen to music and navigate the Internet). Since KBE includes a mechanism for the generation of value, it works without utility functions and does not need to model market exchanges.
Logônia: Plant Growth Response Model in NetLogo
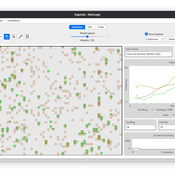
Daniel Vartanian Leandro Garcia Aline | Published Saturday, September 13, 2025 | Last modified Monday, July 13, 2026Logônia is a NetLogo model that simulates the growth response of a fictional plant, Logônia, under different climatic conditions. The model uses climate data from WorldClim 2.1 (Fick & Hijmans, 2017) and demonstrates how to integrate the LogoClim model through the LevelSpace extension.
The model was developed according to the FAIR principles for research software (Barker et al., 2022) and is openly available on the CoMSES Network and GitHub.
Toward Market Structure as a Complex System: A Web Based Simulation Assignment Implemented in Netlogo
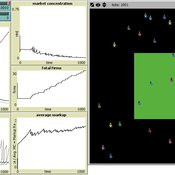
Timothy Kochanski | Published Monday, February 14, 2011 | Last modified Saturday, April 27, 2013This is the model for a paper that is based on a simulation model, programmed in Netlogo, that demonstrates changes in market structure that occur as marginal costs, demand, and barriers to entry change. Students predict and observe market structure changes in terms of number of firms, market concentration, market price and quantity, and average marginal costs, profits, and markups across the market as firms innovate. By adjusting the demand growth and barriers to entry, students can […]
Peer reviewed Organizational behavior in the hierarchy model
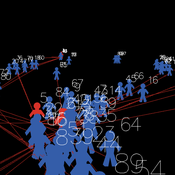
Smarzhevskiy Ivan | Published Tuesday, June 18, 2019 | Last modified Wednesday, July 31, 2019In a two-level hierarchical structure (consisting of the positions of managers and operators), persons holding these positions have a certain performance and the value of their own (personal perception in this, simplified, version of the model) perception of each other. The value of the perception of each other by agents is defined as a random variable that has a normal distribution (distribution parameters are set by the control elements of the interface).
In the world of the model, which is the space of perceptions, agents implement two strategies: rapprochement with agents that perceive positively and distance from agents that perceive negatively (both can be implemented, one of these strategies, or neither, the other strategy, which makes the agent stationary). Strategies are implemented in relation to those agents that are in the radius of perception (PerRadius).
The manager (Head) forms a team of agents. The performance of the group (the sum of the individual productivities of subordinates, weighted by the distance from the leader) varies depending on the position of the agents in space and the values of their individual productivities. Individual productivities, in the current version of the model, are set as a random variable distributed evenly on a numerical segment from 0 to 100. The manager forms the team 1) from agents that are in (organizational) radius (Op_Radius), 2) among agents that the manager perceives positively and / or negatively (both can be implemented, one of the specified rules, or neither, which means the refusal of the command formation).
Agents can (with a certain probability, given by the variable PrbltyOfDecisn%), in case of a negative perception of the manager, leave his group permanently.
It is possible in the model to change on the fly radii values, update the perception value across the entire population and the perception of an individual agent by its neighbors within the perception radius, and the probability values for a subordinate to make a decision about leaving the group.
You can also change the set of strategies for moving agents and strategies for recruiting a team manager. It is possible to add a randomness factor to the movement of agents (Stoch_Motion_Speed, the default is set to 0, that is, there are no random movements).
…
This model extends the original Artifical Anasazi (AA) model to include individual agents, who vary in age and sex, and are aggregated into households. This allows more realistic simulations of population dynamics within the Long House Valley of Arizona from AD 800 to 1350 than are possible in the original model. The parts of this model that are directly derived from the AA model are based on Janssen’s 1999 Netlogo implementation of the model; the code for all extensions and adaptations in the model described here (the Artificial Long House Valley (ALHV) model) have been written by the authors. The AA model included only ideal and homogeneous “individuals” who do not participate in the population processes (e.g., birth and death)–these processes were assumed to act on entire households only. The ALHV model incorporates actual individual agents and all demographic processes affect these individuals. Individuals are aggregated into households that participate in annual agricultural and demographic cycles. Thus, the ALHV model is a combination of individual processes (birth and death) and household-level processes (e.g., finding suitable agriculture plots).
As is the case for the AA model, the ALHV model makes use of detailed archaeological and paleoenvironmental data from the Long House Valley and the adjacent areas in Arizona. It also uses the same methods as the original model (from Janssen’s Netlogo implementation) to estimate annual maize productivity of various agricultural zones within the valley. These estimates are used to determine suitable locations for households and farms during each year of the simulation.
Artificial Long House Valley-Black Mesa
Lisa Sattenspiel Amy Warren | Published Thursday, March 19, 2020This model is an extension of the Artificial Long House Valley (ALHV) model developed by the authors (Swedlund et al. 2016; Warren and Sattenspiel 2020). The ALHV model simulates the population dynamics of individuals within the Long House Valley of Arizona from AD 800 to 1350. Individuals are aggregated into households that participate in annual agricultural and demographic cycles. The present version of the model incorporates features of the ALHV model including realistic age-specific fertility and mortality and, in addition, it adds the Black Mesa environment and population, as well as additional methods to allow migration between the two regions.
As is the case for previous versions of the ALHV model as well as the Artificial Anasazi (AA) model from which the ALHV model was derived (Axtell et al. 2002; Janssen 2009), this version makes use of detailed archaeological and paleoenvironmental data from the Long House Valley and the adjacent areas in Arizona. It also uses the same methods as the original AA model to estimate annual maize productivity of various agricultural zones within the Long House Valley. A new environment and associated methods have been developed for Black Mesa. Productivity estimates from both regions are used to determine suitable locations for households and farms during each year of the simulation.
LogoClim: WorldClim in NetLogo
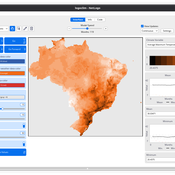
Daniel Vartanian Leandro Garcia Aline Martins de Carvalho Aline | Published Thursday, July 03, 2025 | Last modified Monday, July 13, 2026LogoClim is a NetLogo model designed to be integrated into other simulations through the LevelSpace extension (Hjorth et al., 2020), providing high resolution climate data from sources validated and used by the Intergovernmental Panel on Climate Change (IPCC).
The model simplifies and standardizes the integration of climate data into NetLogo, allowing researchers to focus their efforts on the model itself with the assurance of using reliable and widely recognized data. Although its main use is as a component of larger simulations, LogoClim also has its own graphical interface for monitoring and checking the datasets.
The climate data comes from the WorldClim 2.1 project (Fick & Hijmans, 2017), for which LogoClim works as an interface to NetLogo. The model supports all three WorldClim data series: (1) Historical Climate Data (1970 to 2000), with 12 monthly points for minimum, mean, and maximum temperature, precipitation, solar radiation, wind speed, vapor pressure, elevation, and bioclimatic variables; (2) Historical Monthly Weather Data (1951 to 2024), based on downscaling of CRU-TS-4.09, developed by the Climatic Research Unit at the University of East Anglia (Harris et al., 2020), with minimum and maximum temperature and total precipitation; and (3) Future Climate Data, based on downscaling climate projections derived from global climate models of the Coupled Model Intercomparison Project Phase 6 (CMIP6) (Eyring et al., 2016) for four future periods (2021 to 2040, 2041 to 2060, 2061 to 2080, and 2081 to 2100) and four scenarios based on the Shared Socioeconomic Pathways (SSPs 126, 245, 370, and 585), covering minimum and maximum temperature, total precipitation, and bioclimatic variables. All series are available at multiple spatial resolutions, from 10 minutes (about 340 km² at the equator) to 30 seconds (about 1 km² at the equator).
…
Displaying 10 of 214 results for "David Nortes-Martinez" clear search