Our mission is to help computational modelers develop, document, and share their computational models in accordance with community standards and good open science and software engineering practices. Model authors can publish their model source code in the Computational Model Library with narrative documentation as well as metadata that supports open science and emerging norms that facilitate software citation, computational reproducibility / frictionless reuse, and interoperability. Model authors can also request private peer review of their computational models. Models that pass peer review receive a DOI once published.
All users of models published in the library must cite model authors when they use and benefit from their code.
Please check out our model publishing tutorial and feel free to contact us if you have any questions or concerns about publishing your model(s) in the Computational Model Library.
Displaying 10 of 1284 results Sort by: Recently modified clear search
Timing and certainty in evidence-based decision-making
Sacha Ferrari | Published Saturday, January 25, 2025Model implemented in Lammers, W., Pattyn, V., Ferrari, S. et al. Evidence for policy-makers: A matter of timing and certainty?. Policy Sci 57, 171–191 (2024). https://doi.org/10.1007/s11077-024-09526-9
The impact of scientific networks, affinity bias and scientific uncertainty on the public uptake of science
Sacha Ferrari | Published Thursday, January 23, 2025Ferrari, S., Lammers, W., Wenmackers, S. (forthcoming) How the structure of scientific communities could impact the public uptake of uncertain science. Philosophy of Science.
MeReDiem : Fallow Land Simulations to examine the conditions of sustainable village livelihood
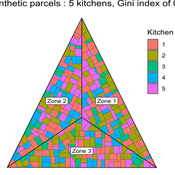
Etienne DELAY Paul Chapron Mathieu | Published Monday, January 20, 2025 | Last modified Tuesday, January 21, 2025The MeReDiem model aims to simulate the effect of socio-agricultural practices of farmers and pastors on the food sustainability and soil fertility of a serrer village, in Senegal. The model is a central part of a companion modeling and exploration approach, described in a paper, currently under review)
The village population is composed of families (kitchens). Kitchens cultivate their land parcels to feed their members, aiming for food security at the family level. On a global level , the village tries to preserve the community fallow land as long as possible.
Kitchens sizes vary depending on the kitchens food production, births and migration when food is insufficient.
…
Soy2Grow-ABM-V1
Siavash Farahbakhsh | Published Monday, January 20, 2025The Soy2Grow ABM aims to simulate the adoption of soybean production in Flanders, Belgium. The model primarily considers two types of agents as farmers: 1) arable and 2) dairy farmers. Each farmer, based on its type, assesses the feasibility of adopting soybean cultivation. The feasibility assessment depends on many interrelated factors, including price, production costs, yield, disease, drought (i.e., environmental stress), social pressure, group formations, learning and skills, risk-taking, subsidies, target profit margins, tolerance to bad experiences, etc. Moreover, after adopting soybean production, agents will reassess their performance. If their performance is unsatisfactory, an agent may opt out of soy production. Therefore, one of the main outcomes to look for in the model is the number of adopters over time.
The main agents are farmers. Generally, factors influencing farmers’ decision-making are divided into seven main areas: 1) external environmental factors, 2) cooperation and learning (with slight differences depending on whether they are arable or dairy farmers), 3) crop-specific factors, 4) economics, 5) support frameworks, 6) behavioral factors, and 7) the role of mobile toasters (applicable only to dairy farmers).
Moreover, factors not only influence decision-making but also interact with each other. Specifically, external environmental factors (i.e., stress) will result in lower yield and quality (protein content). The reducing effect, identified during participatory workshops, can reach 50 %. Skills can grow and improve yield; however, their growth has a limit and follows different learning curves depending on how individualistic a farmer is. During participatory workshops, it was identified that, contrary to cooperative farmers, individualistic farmers may learn faster and reach their limits more quickly. Furthermore, subsidies directly affect revenues and profit margins; however, their impact may disappear when they are removed. In the case of dairy farmers, mobile toasters play an important role, adding toasting and processing costs to those producing soy for their animal feed consumption.
Last but not least, behavioral factors directly influence the final adoption decision. For example, high risk-taking farmers may adopt faster, whereas more conservative farmers may wait for their neighbors to adopt first. Farmers may evaluate their success based on their own targets and may also consider other crops rather than soy.
The doctrinal paradox in deliberative process and in majority voting
Sacha Ferrari | Published Monday, January 13, 2025This model proposes a new approach analyzing to the doctrinal paradox by considering a deliberative process (which can be represented by an agent-based model) in comparison with classical (binary) majority voting and an aggregation of (continuous) degrees of belief prior to majority voting. This model is a multivariate extension of the Hegselmann–Krause opinion dynamics model.
On the liquidity of the illiquid (hard-to-trade) assets
Marcin Czupryna | Published Monday, January 13, 2025This paper investigates the impact of agents' trading decisions on market liquidity and transactional efficiency in markets for illiquid (hard-to-trade) assets. Drawing on a unique order book dataset from the fine wine exchange Liv-ex, we offer novel insights into liquidity dynamics in illiquid markets. Using an agent-based framework, we assess the adequacy of conventional liquidity measures in capturing market liquidity and transactional efficiency. Our main findings reveal that conventional liquidity measures, such as the number of bids, asks, new bids and new asks, may not accurately represent overall transactional efficiency. Instead, volume (measured by the number of trades) and relative spread measures may be more appropriate indicators of liquidity within the context of illiquid markets. Furthermore, our simulations demonstrate that a greater number of traders participating in the market correlates with an increased efficiency in trade execution, while wider trader-set margins may decrease the transactional efficiency. Interestingly, the trading period of the agents appears to have a significant impact on trade execution. This suggests that granting market participants additional time for trading (for example, through the support of automated trading systems) can enhance transactional efficiency within illiquid markets. These insights offer practical implications for market participants and policymakers aiming to optimise market functioning and liquidity.
BarterNet is a platform for modeling early barter networks with the aim of learning how supply and demand for a good determine if traders will learn to use that good as a form of money. Traders use a good as money when they offer to trade for it even if they can’t consume it, but believe that they can subsequently trade it for a good they can consume in the near future.
Status hierarchies and the emergence of cooperation in task groups
Hsuan-Wei Lee | Published Thursday, January 02, 2025This repository contains an agent-based simulation model exploring how status hierarchies influence the emergence and sustainability of cooperation in task-oriented groups. The model builds on evolutionary game theory to examine the dynamics of cooperation under single-leader and multi-leader hierarchies, investigating factors such as group size, assortativity, and hierarchical clarity. Key findings highlight the trade-offs between different leadership structures in fostering group cooperation and reveal the conditions under which cooperation is most stable.
The repository includes code for simulations, numerical analysis scripts, and visualization tools to replicate the results presented in the manuscript titled “Status hierarchies and the emergence of cooperation in task groups.”
Feel free to explore, reproduce the findings, or adapt the model for further research!
Gini Palma microsimulation
Edgar Oliveira | Published Wednesday, December 11, 2024The model is a microsimulation, where the agents don’t Interact with each other. It simulates income distribution, unemployment dynamics, education, and Family grant in Brazil, focusing on the impact on social inequality. It tracks the indicators Gini index, Lorenz curve, and Palma ratio. The objective is to explore how these factors influence wealth distribution and social inequality over time.
This work was developed in partnership with the Graduate Program in Computational Modeling, in the Universidade Federal do Rio Grande - FURG, in Brazil.
A formalized implementation of Halstead and O’Shea’s Bad Year Economics. The agent population uses one of four resilience strategies in an attempt to cope with a dynamic environment of stresses and shocks.
Displaying 10 of 1284 results Sort by: Recently modified clear search