Our mission is to help computational modelers develop, document, and share their computational models in accordance with community standards and good open science and software engineering practices. Model authors can publish their model source code in the Computational Model Library with narrative documentation as well as metadata that supports open science and emerging norms that facilitate software citation, computational reproducibility / frictionless reuse, and interoperability. Model authors can also request private peer review of their computational models. Models that pass peer review receive a DOI once published.
All users of models published in the library must cite model authors when they use and benefit from their code.
Please check out our model publishing tutorial and feel free to contact us if you have any questions or concerns about publishing your model(s) in the Computational Model Library.
Displaying 9 of 9 results car clear search
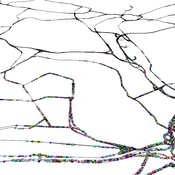
A simulation model for Dublin city
umesh7lowe | Published Friday, April 10, 2026An agent-based model of urban travel behaviour in Dublin, Ireland, built in NetLogo and empirically grounded in 2016 travel survey data. Each agent represents a Dublin resident initialised with real socio-demographic attributes — including age, gender, household size and car ownership, income, driving licence status, and access to local amenities — alongside observed trip characteristics such as distance, travel time, and trip type (work, shopping, leisure).
At each time step, agents choose between four transport modes (car, public transport, cycling, and walking) across short, medium, and long trips. Mode choice is governed by a preference vector that weighs personal need satisfaction against social influence from neighbouring agents reflecting consumat framework. Satisfaction evolves dynamically based on cost (incorporating Irish motor tax bands and per-km operating rates), travel time, and trip-type suitability, with an uncertainty parameter capturing variability in perceived utility over time.
The model tracks aggregate modal shares and total CO2 emission at each tick, enabling exploration of how policy interventions — such as fuel taxation, public transport pricing, or active travel incentives — might shift the city’s travel demand profile over 100 simulated days.
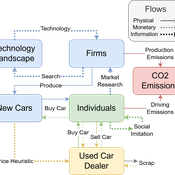
Driving in the wrong direction? A co-evolutionary model of electric vehicle adoption and innovation
Daniel Torren-Peraire | Published Friday, July 11, 2025Car-centric societies face substantial challenges in moving towards sustainable
mobility systems, with internal combustion engine vehicles remaining a major
source of emissions. Electric vehicles play a critical role in addressing this challenge, yet their diffusion depends on the interaction of consumer behaviour, firm
innovation, and policy incentives. This paper develops an agent-based model to
examine these dynamics, calibrated on the data for the state of California over
2001-2023. In the model, heterogeneous car users influenced by their social peers
…
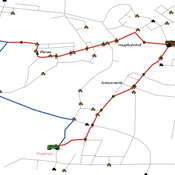
Simulating changing traffic flow caused by new bus route in Augsburg
Eduard | Published Wednesday, August 04, 2021This is a Netlogo model which simulates car and bus/tram traffic in Augsburg, specifically between the districts Stadtbergen, Göggingen and the Königsplatz. People either use their cars or public transport to travel to one of their random destinations (Stadtbergen or Göggingen), performing some activity and then returning to their home. Attributes such as travel and waiting time as well as their happiness upon arriving are stored and have an impact on individuals on whether they would consider changing their mode of transport or not.
This model presents an autonomous, two-lane driving environment with a single lane-closure that can be toggled. The four driving scenarios - two baseline cases (based on the real-world) and two experimental setups - are as follows:
- Baseline-1 is where cars are not informed of the lane closure.
- Baseline-2 is where a Red Zone is marked wherein cars are informed of the lane closure ahead.
- Strategy-1 is where cars use a co-operative driving strategy - FAS. <sup>[1]</sup>
- Strategy-2 is a variant of Strategy-1 and uses comfortable deceleration values instead of the vehicle’s limit.
…
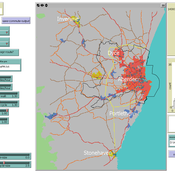
Transport simulation in a real road network
Gary Polhill Jiaqi Ge | Published Tuesday, April 17, 2018 | Last modified Tuesday, April 17, 2018Ge, J., & Polhill, G. (2016). Exploring the Combined Impact of Factors Influencing Commuting Patterns and CO2 Emission in Aberdeen Using an Agent-Based Model. Journal of Artificial Societies and Social Simulation, 19(3). http://jasss.soc.surrey.ac.uk/19/3/11.html
We develop an agent-based transport model using a realistic GIS-enabled road network and the car following method. The model can be used to study the impact of social interventions such as flexi-time and workplace sharing, as well as large infrastructure such as the construction of a bypass or highway. The model is developed in Netlogo version 5 and requires road network data in GIS format to run.
Hybrid traffic model
Patrick Taillandier Arnaud Banos Nathalie Corson | Published Thursday, March 16, 2017The model aims at simulating the car traffic. It allows to use either a macro or a micro sub-model for the simulation of the flow on the roads.
TransportVarese
Elena Vallino Elena Maggi | Published Tuesday, January 31, 2017 | Last modified Friday, August 04, 2017This ABM deals with commuting choices in the Italian city of Varese. Empirical data inform agents’ attitudes and modal choices costs and emissions. We evaluate ex ante the impact of policies for less polluting commuting choices.
STECCAR: a simulation of the diffusion of electric cars
A Kangur Lc Verbrugge W Jager M Bockarjova | Published Sunday, November 29, 2015In this Repast model the ‘Consumat’ cognitive framework is applied to an ABM of the Dutch car market. Different policy scenarios can be selected or created to examine their effect on the diffusion of EVs.
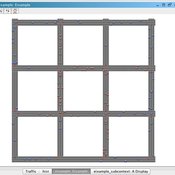
Eixample-MAS Traffic Simulation
Àlex Pardo Fernandez David Sánchez Pinsach | Published Tuesday, January 22, 2013 | Last modified Saturday, April 27, 2013This MAS simulates the traffic of Barcelona Eixample. Uses a centralized AI system in order to control the traffic lights. Car agents are reactive and have no awareness of the intelligence of the system. They (try to) avoid collisions.