Our mission is to help computational modelers develop, document, and share their computational models in accordance with community standards and good open science and software engineering practices. Model authors can publish their model source code in the Computational Model Library with narrative documentation as well as metadata that supports open science and emerging norms that facilitate software citation, computational reproducibility / frictionless reuse, and interoperability. Model authors can also request private peer review of their computational models. Models that pass peer review receive a DOI once published.
All users of models published in the library must cite model authors when they use and benefit from their code.
Please check out our model publishing tutorial and feel free to contact us if you have any questions or concerns about publishing your model(s) in the Computational Model Library.
Displaying 10 of 1321 results Sort by: Recently modified clear search
Asymmetric Demographic Hysteresis in a Spatial Agent-Based Urban System
Chen Shen | Published Friday, July 24, 2026This paper develops a spatial agent-based model to examine how fertility regime shifts reshape population concentration and wealth distribution in an abstract urban system. Migration decisions combine population preference, cultural homophily, expected net income, and resource endowment through a standardised softmax utility. The design is deliberately stylised: it is not calibrated to a particular country or city system, but is intended to isolate the feedbacks linking migration, fertility, urban scaling, and accumulated wealth.
The simulations reveal robust directional asymmetry. When fertility shifts from low to high, population concentration responds rapidly; when fertility shifts from high to low, concentration declines only after a detectable delay and may temporarily continue in the previous direction. Wealth adds a second layer of hysteresis: cell total-wealth concentration follows population concentration with delay, cell mean-wealth inequality and system-level wealth indicators are slower still, and phase-space trajectories form loops rather than collapsing onto a single population–wealth curve. Robustness experiments indicate that longer fertility cycles, wider mobility neighbourhoods, and smoother resource landscapes change the magnitude of delay and overshoot, but do not remove the qualitative asymmetry. The paper argues that demographic decline should be understood not as the mirror image of demographic expansion, but as a path-dependent transition mediated by fast migration-income feedbacks and slower fertility, cohort, culture, and wealth mechanisms.
Peer reviewed STiMUS: A Stigmergic–Mutualistic Agent-Based Model of Teamwork on Shared Digital Artefacts (IMOI)
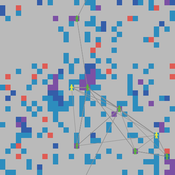
Yevgeny Patarakin | Published Friday, July 03, 2026 | Last modified Wednesday, July 22, 2026STiMUS (Stigmergic–Mutualistic IMOI Model) is an agent-based model of teamwork in socio-technical systems where contributors collaborate through shared digital artefacts — wiki pages, code files, issue tickets, project cards, Scratch projects — represented as patches in a NetLogo world. The model integrates two coordination mechanisms. Stigmergy is indirect coordination through traces left in a shared environment: each edit deposits a pheromone that diffuses to neighbouring patches and evaporates over time, so recent activity attracts further contributions. Mutualism is a reciprocal benefit loop in which valuable, well-maintained artefacts raise contributor motivation and shared understanding, while motivated contributors improve artefacts.
Contributors (turtles of the contributor breed) carry individual state: skill, motivation, shared-mental-model, specialty, benefit-gain, and an explicit-mode flag. At each tick every contributor selects a target artefact with an ant-colony-optimization-style rule weighing the artefact’s pheromone, incompleteness (1 - completeness), resource-value, and topic match between specialty and the artefact’s topic-tag; with probability p-explicit it instead takes the patch with the highest maintenance-need, modelling explicit task assignment. Each edit increases pheromone, quality, completeness and reuse-count, raises resource-value, lowers maintenance-need, and appends the editor to the artefact’s edit-authors list. When the previous last-editor-id differs from the current editor, the Edit Succession Ratio rises, the editor’s shared-mental-model grows, and a co-editing link is created — operationalising the idea that repeated cross-author succession on the same artefact builds shared understanding. Contributors’ motivation is updated from the benefit drawn from the visited artefact.
Each patch maintains a stigmergic layer (pheromone, quality, completeness, recentness, last-editor-id, edit-count, edit-authors) and a mutualistic layer (resource-value, reuse-count, maintenance-need, topic-tag), plus task flags (is-task?, task-complexity). Global monitors report the Edit Succession Ratio (ESR = cross-author-edits / total-edits, and an alternative esr-value = share of edited patches with more than one distinct author), mean-quality, mean-resource-value, a mutualism-index averaging contributor benefit and resource value, coediting-density (network density of the co-editing graph), active-pages-share, and task-completion-rate. The model logs every edit as a bipartite edge (tick, author_id, pageid, specialty, topic_tag, quality), exportable to CSV.
…
AAAPS: AI-Augmented Academic Performance Simulation
Tuul Triyason | Published Wednesday, July 22, 2026Agent-based model simulating 60 undergraduate CS students over 8 semesters to investigate how differential AI tool access affects academic inequality, performance distributions, and dependency formation. Implements a three-phase AI dependency mechanism (effort reduction, metacognitive miscalibration, capability erosion) under five policy scenarios with a 4,050-run parameter sensitivity sweep.
Amber Dilemma Zone: Driver Cognition and Signal Control in Urban Traffic
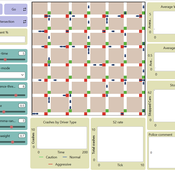
Mansoor Abdul Bari | Published Sunday, July 19, 2026This model is an extension of Wilensky’s (2003) Traffic Grid, a foundational NetLogo model of urban traffic flow. It embeds a dual-process cognitive architecture into each driver agent, transforming the original’s identical reactive units into cognitively heterogeneous individuals whose internal mental state evolves with experience; making the same intersection produce different decisions from different drivers, and different decisions from the same driver across occasions.
The core question the model addresses is the yellow-light dilemma zone: the seconds following amber onset in which a driver can neither stop safely nor clear the intersection before red. Field research documents that behavioral variance at this moment cannot be explained by geometry or legal obligation alone. This model provides the cognitive architecture that has been missing from traffic ABMs.
Each driver routes every amber-onset decision through either System 1 (fast, heuristic, automatic) or System 2 (slow, deliberative, prospect-theoretic), switching dynamically based on cognitive load, accumulated near-miss memory, and situational framing. The result is crash outcomes that are attributable, path-dependent, and sensitive to both driver disposition and signal infrastructure; none of which fixed-rule models can reproduce. Three signal control modes are included: fixed-cycle (replicating Wilensky’s original), adaptive-queue, and smart occupancy-based switching.
Fragile, Resilient, Asymmetric: An Agent-Based Stress Test of European Cooperation under Geopolitical Shocks (2024-2040)
Alessandro Brugnoletti | Published Thursday, July 16, 2026An empirically calibrated agent-based model of cooperation among 14 EU member states. Adaptive state-agents update their cooperation propensity through behavioural inertia, influence along the observed intra-EU trade network (IMF bilateral flows), and repeated-game payoff indicators built from verified Eurostat, Eurobarometer and IMF data (2021-2024). An anchored logistic mapping makes the observed configuration stationary in the absence of shocks, so outcomes read as deviations from the empirical baseline. The model stress-tests European cooperation to 2040 under five scenarios of increasing severity, from a baseline to a Taiwan Strait crisis counterfactual, with 1,000 Monte Carlo replications and a full sensitivity suite (one-factor-at-a-time, joint parameter sampling, breaking-point analysis, alternative functional form). Documented with the ODD protocol; self-testing and fully reproducible under fixed seeds.
Logônia: Plant Growth Response Model in NetLogo
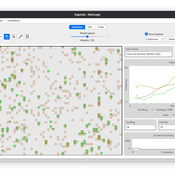
Daniel Vartanian Leandro Garcia Aline | Published Saturday, September 13, 2025 | Last modified Monday, July 13, 2026Logônia is a NetLogo model that simulates the growth response of a fictional plant, Logônia, under different climatic conditions. The model uses climate data from WorldClim 2.1 (Fick & Hijmans, 2017) and demonstrates how to integrate the LogoClim model through the LevelSpace extension.
The model was developed according to the FAIR principles for research software (Barker et al., 2022) and is openly available on the CoMSES Network and GitHub.
LogoClim: WorldClim in NetLogo
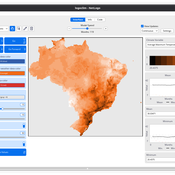
Daniel Vartanian Leandro Garcia Aline Martins de Carvalho Aline | Published Thursday, July 03, 2025 | Last modified Monday, July 13, 2026LogoClim is a NetLogo model designed to be integrated into other simulations through the LevelSpace extension (Hjorth et al., 2020), providing high resolution climate data from sources validated and used by the Intergovernmental Panel on Climate Change (IPCC).
The model simplifies and standardizes the integration of climate data into NetLogo, allowing researchers to focus their efforts on the model itself with the assurance of using reliable and widely recognized data. Although its main use is as a component of larger simulations, LogoClim also has its own graphical interface for monitoring and checking the datasets.
The climate data comes from the WorldClim 2.1 project (Fick & Hijmans, 2017), for which LogoClim works as an interface to NetLogo. The model supports all three WorldClim data series: (1) Historical Climate Data (1970 to 2000), with 12 monthly points for minimum, mean, and maximum temperature, precipitation, solar radiation, wind speed, vapor pressure, elevation, and bioclimatic variables; (2) Historical Monthly Weather Data (1951 to 2024), based on downscaling of CRU-TS-4.09, developed by the Climatic Research Unit at the University of East Anglia (Harris et al., 2020), with minimum and maximum temperature and total precipitation; and (3) Future Climate Data, based on downscaling climate projections derived from global climate models of the Coupled Model Intercomparison Project Phase 6 (CMIP6) (Eyring et al., 2016) for four future periods (2021 to 2040, 2041 to 2060, 2061 to 2080, and 2081 to 2100) and four scenarios based on the Shared Socioeconomic Pathways (SSPs 126, 245, 370, and 585), covering minimum and maximum temperature, total precipitation, and bioclimatic variables. All series are available at multiple spatial resolutions, from 10 minutes (about 340 km² at the equator) to 30 seconds (about 1 km² at the equator).
…

Peer reviewed Party Competition with Costly Voting
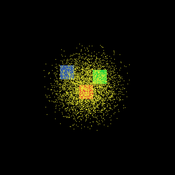
Thomas Mustillo | Published Tuesday, July 07, 2026Party Competition with Costly Voting builds upon the baseline model in Chapter 5 from Laver and Sergenti’s Party Competition (2011); it adds voting costs to generate variable turnout.
Party Competition with Opinion Dynamics
Marco Janssen | Published Sunday, June 28, 2026We combine a model of parties adjusting their position to recruit voters, and voters adjusting their opinions due to social influence and party positions.
Political Competition
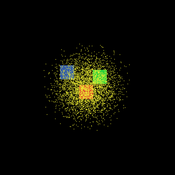
Marco Janssen | Published Sunday, June 28, 2026Political parties compete for voters by (re-) positioning themselves within the opinion space.
Displaying 10 of 1321 results Sort by: Recently modified clear search