About the CoMSES Model Library more info
Our mission is to help computational modelers at all levels engage in the establishment and adoption of community standards and good practices for developing and sharing computational models. Model authors can freely publish their model source code in the Computational Model Library alongside narrative documentation, open science metadata, and other emerging open science norms that facilitate software citation, reproducibility, interoperability, and reuse. Model authors can also request peer review of their computational models to receive a DOI.
All users of models published in the library must cite model authors when they use and benefit from their code.
Please check out our model publishing tutorial and contact us if you have any questions or concerns about publishing your model(s) in the Computational Model Library.
We also maintain a curated database of over 7500 publications of agent-based and individual based models with additional detailed metadata on availability of code and bibliometric information on the landscape of ABM/IBM publications that we welcome you to explore.
Displaying 10 of 226 results other clear search
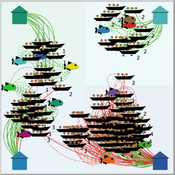
Peer reviewed FishMob: Interactions between fisher mobility and spatial resource heterogeneity
Emilie Lindkvist | Published Wednesday, October 16, 2019 | Last modified Tuesday, June 23, 2020Migration or other long-distance movement into other regions is a common strategy of fishers and fishworkers living and working on the coast to adapt to environmental change. This model attempts to understand the general dynamics of fisher mobility for over larger spatial scales. The model can be used for investigating the complex interplay that exists between mobility and fish stock heterogeneity across regions, and the associated outcomes of mobility at the system level.
The model design informed by the example of small-scale fisheries in the Gulf of California, Mexico but implements theoretical and stylized facts and can as such be used for different archetypical cases. Our methodological approach for designing the model aims to account for the complex causation, emergence and interdependencies in small-scale fisheries to explain the phenomenon of sequential overexploitation, i.e., overexploiting one resource after another. The model is intended to be used as a virtual laboratory to investigate when and how different levels of mobile fishers affect exploitation patterns of fisheries resources.
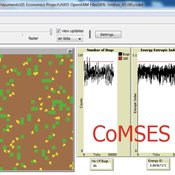
07 EffLab_V5.07 NL
Garvin Boyle | Published Monday, October 07, 2019EffLab was built to support the study of the efficiency of agents in an evolving complex adaptive system. In particular:
- There is a definition of efficiency used in ecology, and an analogous definition widely used in business. In ecological studies it is called EROEI (energy returned on energy invested), or, more briefly, EROI (pronounced E-Roy). In business it is called ROI (dollars returned on dollars invested).
- In addition, there is the more well-known definition of efficiency first described by Sadi Carnot, and widely used by engineers. It is usually represented by the Greek letter ‘h’ (pronounced as ETA). These two measures of efficiency bear a peculiar relationship to each other: EROI = 1 / ( 1 - ETA )
In EffLab, blind seekers wander through a forest looking for energy-rich food. In this multi-generational world, they live and reproduce, or die, depending on whether they can find food more effectively than their contemporaries. Data is collected to measure their efficiency as they evolve more effective search patterns.
…
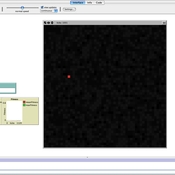
00b SimEvo_V5.08 NetLogo
Garvin Boyle | Published Saturday, October 05, 2019In 1985 Dr Michael Palmiter, a high school teacher, first built a very innovative agent-based model called “Simulated Evolution” which he used for teaching the dynamics of evolution. In his model, students can see the visual effects of evolution as it proceeds right in front of their eyes. Using his schema, small linear changes in the agent’s genotype have an exponential effect on the agent’s phenotype. Natural selection therefore happens quickly and effectively. I have used his approach to managing the evolution of competing agents in a variety of models that I have used to study the fundamental dynamics of sustainable economic systems. For example, here is a brief list of some of my models that use “Palmiter Genes”:
- ModEco - Palmiter genes are used to encode negotiation strategies for setting prices;
- PSoup - Palmiter genes are used to control both motion and metabolic evolution;
- TpLab - Palmiter genes are used to study the evolution of belief systems;
- EffLab - Palmiter genes are used to study Jevon’s Paradox, EROI and other things.
…
Policies to reconnect a city and the countryside
Gert Jan Hofstede Tim Verwaart | Published Monday, September 23, 2019The agent-based model captures the spatio-temporal institutional dynamics of the economy over the years at the level of a Dutch province. After 1945, Noord-Brabant in the Netherlands has been subject to an active program of economic development through the stimulation of pig husbandry. This has had far-reaching effects on its economy, landscape, and environment. The agents are households. The simulation is at institutional level, with typical stakeholder groups, lobbies, and political parties playing a role in determining policies that in turn determine economic, spatial and ecological outcomes. It allows to experiment with alternative scenarios based on two political dimensions: local versus global issues, and economic versus social responsibilitypriorities. The model shows very strong sensitivity to political context. It can serve as a reference model for other cases where “artificial institutional economics” is attempted.
Agent-based Model of Industrial Evolution
Martin Zoričak Denis Horvath Vladimir Gazda Oto Hudec | Published Wednesday, July 10, 2019This is a conceptual model of underlying forces creating industrial clusters. There are two contradictory forces - attraction and repulsion. Firms within the same Industry are attracted to each other and on the other hand, firms with the same Activity are repulsed from each other. In each round firm with the lowest fitness is selected to change its profile of Industries and Activities. Based on these simple rules interesting patterns emerge.
Individual-based modelling as a tool for elephant poaching mitigation
Ernesto Carrella Richard Bailey Emily Neil Jens Koed Madsen Nicolas Payette | Published Tuesday, June 18, 2019 | Last modified Thursday, August 01, 2019We develop an IBM that predicts how interactions between elephants, poachers, and law enforcement affect poaching levels within a virtual protected area. The model is theoretical at this stage and is not meant to provide a realistic depiction of poaching, but instead to demonstrate how IBMs can expand upon the existing modelling work done in this field, and to provide a framework for future research. The model could be further developed into a useful management support tool to predict the outcomes of various poaching mitigation strategies at real-world locations. The model was implemented in NetLogo version 6.1.0.
We first compared a scenario in which poachers have prescribed, non-adaptive decision-making and move randomly across the landscape, to one in which poachers adaptively respond to their memories of elephant locations and where other poachers have been caught by law enforcement. We then compare a situation in which ranger effort is distributed unevenly across the protected area to one in which rangers patrol by adaptively following elephant matriarchal herds.
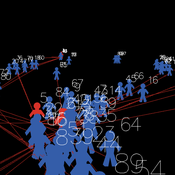
Peer reviewed Organizational behavior in the hierarchy model
Smarzhevskiy Ivan | Published Tuesday, June 18, 2019 | Last modified Wednesday, July 31, 2019In a two-level hierarchical structure (consisting of the positions of managers and operators), persons holding these positions have a certain performance and the value of their own (personal perception in this, simplified, version of the model) perception of each other. The value of the perception of each other by agents is defined as a random variable that has a normal distribution (distribution parameters are set by the control elements of the interface).
In the world of the model, which is the space of perceptions, agents implement two strategies: rapprochement with agents that perceive positively and distance from agents that perceive negatively (both can be implemented, one of these strategies, or neither, the other strategy, which makes the agent stationary). Strategies are implemented in relation to those agents that are in the radius of perception (PerRadius).
The manager (Head) forms a team of agents. The performance of the group (the sum of the individual productivities of subordinates, weighted by the distance from the leader) varies depending on the position of the agents in space and the values of their individual productivities. Individual productivities, in the current version of the model, are set as a random variable distributed evenly on a numerical segment from 0 to 100. The manager forms the team 1) from agents that are in (organizational) radius (Op_Radius), 2) among agents that the manager perceives positively and / or negatively (both can be implemented, one of the specified rules, or neither, which means the refusal of the command formation).
Agents can (with a certain probability, given by the variable PrbltyOfDecisn%), in case of a negative perception of the manager, leave his group permanently.
It is possible in the model to change on the fly radii values, update the perception value across the entire population and the perception of an individual agent by its neighbors within the perception radius, and the probability values for a subordinate to make a decision about leaving the group.
You can also change the set of strategies for moving agents and strategies for recruiting a team manager. It is possible to add a randomness factor to the movement of agents (Stoch_Motion_Speed, the default is set to 0, that is, there are no random movements).
…
MERCURY extension: population
Tom Brughmans | Published Thursday, May 23, 2019This model is an extended version of the original MERCURY model (https://www.comses.net/codebases/4347/releases/1.1.0/ ) . It allows for experiments to be performed in which empirically informed population sizes of sites are included, that allow for the scaling of the number of tableware traders with the population of settlements, and for hypothesised production centres of four tablewares to be used in experiments.
Experiments performed with this population extension and substantive interpretations derived from them are published in:
Hanson, J.W. & T. Brughmans. In press. Settlement scale and economic networks in the Roman Empire, in T. Brughmans & A.I. Wilson (ed.) Simulating Roman Economies. Theories, Methods and Computational Models. Oxford: Oxford University Press.
…
Peer reviewed Charging behaviour of electric vehicle drivers
Wilfried van Sark Annemijn Peters Floor Alkemade Mart van der Kam | Published Wednesday, May 08, 2019 | Last modified Tuesday, April 14, 2020This model was developed to study the combination of electric vehicles (EVs) and intermitten renewable energy sources. The model presents an EV fleet in a fictional area, divided into a residential area, an office area and commercial area. The area has renewable energy sources: wind and PV solar panels. The agents can be encouraged to charge their electric vehicles at times of renewable energy surplus by introducing different policy interventions. Other interesting variables in the model are the installed renewable energy sources, EV fleet composition and available charging infrastructure. Where possible, use emperical data as input for our model. We expand upon previous models by incorporating environmental self-identity and range anxiety as agent variables.
St Anthony flu
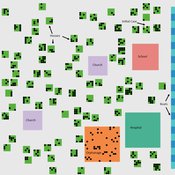
Lisa Sattenspiel | Published Monday, April 15, 2019The St Anthony flu model is an epidemiological model designed to test hypotheses related to the spread of the 1918 influenza pandemic among residents of a small fishing community in Newfoundland and Labrador. The 1921 census data from Newfoundland and Labrador are used to ensure a realistic model population; the community of St. Anthony, NL, located on the tip of the Northern Peninsula of the island of Newfoundland is the specific population modeled. Model agents are placed on a map-like grid that consists of houses, two churches, a school, an orphanage, a hospital, and several boats. They engage in daily activities that reflect known ethnographic patterns of behavior in St. Anthony and other similar communities. A pathogen is introduced into the community and then it spreads throughout the population as a consequence of individual agent movements and interactions.
Displaying 10 of 226 results other clear search