About the CoMSES Model Library more info
Our mission is to help computational modelers develop, document, and share their computational models in accordance with community standards and good open science and software engineering practices. Model authors can publish their model source code in the Computational Model Library with narrative documentation as well as metadata that supports open science and emerging norms that facilitate software citation, computational reproducibility / frictionless reuse, and interoperability. Model authors can also request private peer review of their computational models. Models that pass peer review receive a DOI once published.
All users of models published in the library must cite model authors when they use and benefit from their code.
Please check out our model publishing tutorial and feel free to contact us if you have any questions or concerns about publishing your model(s) in the Computational Model Library.
We also maintain a curated database of over 7500 publications of agent-based and individual based models with detailed metadata on availability of code and bibliometric information on the landscape of ABM/IBM publications that we welcome you to explore.
Displaying 10 of 866 results for "Jes%C3%BAs M Zamarre%C3%B1o" clear search
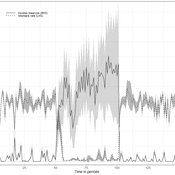
A basic macroeconomic agent-based model for analyzing monetary regime shifts
Oliver Reinhardt Florian Peters Doris Neuberger Adelinde Uhrmacher | Published Tuesday, May 03, 2022In macroeconomics, an emerging discussion of alternative monetary systems addresses the dimensions of systemic risk in advanced financial systems. Monetary regime changes with the aim of achieving a more sustainable financial system have already been discussed in several European parliaments and were the subject of a referendum in Switzerland. However, their effectiveness and efficacy concerning macro-financial stability are not well-known. This paper introduces a macroeconomic agent-based model (MABM) in a novel simulation environment to simulate the current monetary system, which may serve as a basis to implement and analyze monetary regime shifts. In this context, the monetary system affects the lending potential of banks and might impact the dynamics of financial crises. MABMs are predestined to replicate emergent financial crisis dynamics, analyze institutional changes within a financial system, and thus measure macro-financial stability. The used simulation environment makes the model more accessible and facilitates exploring the impact of different hypotheses and mechanisms in a less complex way. The model replicates a wide range of stylized economic facts, including simplifying assumptions to reduce model complexity.
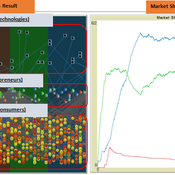
The simulation on the study of the optimal business strategy with the interaction between technologies and consumers.
sej-yoo | Published Monday, June 27, 2022 | Last modified Monday, July 04, 2022HOW IT WORKS
This model consists of three agents, and each agent type operates per business theories as below.
a. New technologies(Tech): It evolves per sustaining or disruptive technology trajectory with the constraint of project management triangle (Scope, Time, Quality, and Cost).
b. Entrepreneurs(Entre): It builds up the solution by combining Tech components per its own strategy (Exploration, Exploitation, or Ambidex).
c. Consumer(Consumer): It selects the solution per its own preference due to Diffusion of innovation theory (Innovators, Early Adopters, Early Majority, Late Majority, Laggards)
…
Integrate land use policies into the agent-based model to simulate land use change
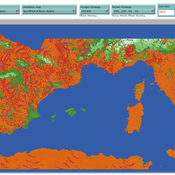
Jing Gao | Published Sunday, June 09, 2024This study employs a hierarchical cross-departmental ABM to explore the question: How and to what extent are the land use policies enforced when assessed against the real-world land use pattern? Specifically, two sub-questions are of interest: How can real-world policy interactions be abstracted into the behavior across hierarchical governmental departments in the model? How can the level of enforcement for each land use policy be quantified under these interactions? We build three hierarchical agents—the central level, the local level that incorporates three departments, and the village collective level—with simplified but plausible processes of land use change, with levels of enforcement of different land use policies as key parameters. We calibrate the model using a genetic algorithm to determine those parameters and answer our research question. We further applied the model to simulate potential land use changes and investigate the implications of different policy options. The results are expected to provide insights into the intricate relationships shaping land use processes, contributing to evidence-based decision-making in urban planning and sustainable land use management.
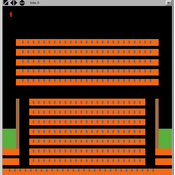
Replica of Turchin's (2003) Metaethnic Frontier model
Paul Smaldino | Published Sunday, February 15, 2026In his 2003 book, Historical Dynamics (ch. 4), Turchin describes and briefly analyzes a spatial ABM of his metaethnic frontier theory, which is essentially a formalization of a theory by Ibn Khaldun in the 14th century. In the model, polities compete with neighboring polities and can absorb them into an empire. Groups possess “asabiya”, a measure of social solidarity and a sense of shared purpose. Regions that share borders with other groups will have increased asabiya do to salient us vs. them competition. High asabiya enhances the ability to grow, work together, and hence wage war on neighboring groups and assimilate them into an empire. The larger the frontier, the higher the empire’s asabiya.
As an empire expands, (1) increased access to resources drives further growth; (2) internal conflict decreases asabiya among those who live far from the frontier; and (3) expanded size of the frontier decreases ability to wage war along all frontiers. When an empire’s asabiya decreases too much, it collapses. Another group with more compelling asabiya eventually helps establish a new empire.
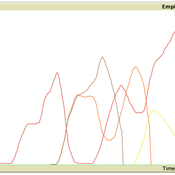
Exploring the aftermath of transition failures: An agent-based model
Gangmin Park Junmin Lee Jisoo Lee Keungoui Kim | Published Friday, March 06, 2026This computational model is an agent-based model (ABM) developed to investigate how repeated failures of emerging niches accumulate and influence the trajectory of socio-technical transitions. Built in AnyLogic 8.7.11, the model simulates the dynamic interactions between a dominant regime and sequential niche entrants within a two-dimensional practice space. It models alignment, movement, and competition based on technological maturity and market penetration. The model utilizes a reinforcing feedback structure linking consumer support, output, resource accumulation, and capacity development (Physical and Institutional Capacity). A complete model specification following the ODD+D (Overview, Design concepts, Details, and Decision) protocol is included in the documentation.
On July 20th, James Holmes committed a mass shooting in a midnight showing of The Dark Knight Rises. The Aurora Colorado shooting was used as a test case to validate this framework for modeling mass shootings.
06b EiLab_Model_I_V5.00 NL
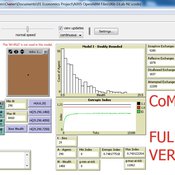
Garvin Boyle | Published Saturday, October 05, 2019EiLab - Model I - is a capital exchange model. That is a type of economic model used to study the dynamics of modern money which, strangely, is very similar to the dynamics of energetic systems. It is a variation on the BDY models first described in the paper by Dragulescu and Yakovenko, published in 2000, entitled “Statistical Mechanics of Money”. This model demonstrates the ability of capital exchange models to produce a distribution of wealth that does not have a preponderance of poor agents and a small number of exceedingly wealthy agents.
This is a re-implementation of a model first built in the C++ application called Entropic Index Laboratory, or EiLab. The first eight models in that application were labeled A through H, and are the BDY models. The BDY models all have a single constraint - a limit on how poor agents can be. That is to say that the wealth distribution is bounded on the left. This ninth model is a variation on the BDY models that has an added constraint that limits how wealthy an agent can be? It is bounded on both the left and right.
EiLab demonstrates the inevitable role of entropy in such capital exchange models, and can be used to examine the connections between changing entropy and changes in wealth distributions at a very minute level.
…

Peer reviewed Torsten Hägerstrand’s Spatial Innovation Diffusion Model
Sean Bergin | Published Friday, September 14, 2012 | Last modified Saturday, April 27, 2013This model is a replication of Torsten Hägerstrand’s 1965 model–one of the earliest known calibrated and validated simulations with implicit “agent based” methodology.
The Cardial Spread Model
Sean Bergin | Published Friday, September 29, 2017 | Last modified Monday, February 04, 2019The purpose of this model is to provide a platform to test and compare four conceptual models have been proposed to explain the spread of the Impresso-Cardial Neolithic in the west Mediterranean.
Growing Unpopular Norms. A Network-Situated ABM of Norm Choice.
C Merdes | Published Tuesday, November 22, 2016 | Last modified Saturday, March 17, 2018The model’s purpose is to provide a potential explanation for the emergence, sustenance and decline of unpopular norms based on pluralistic ignorance on a social network.
Displaying 10 of 866 results for "Jes%C3%BAs M Zamarre%C3%B1o" clear search