Our mission is to help computational modelers develop, document, and share their computational models in accordance with community standards and good open science and software engineering practices. Model authors can publish their model source code in the Computational Model Library with narrative documentation as well as metadata that supports open science and emerging norms that facilitate software citation, computational reproducibility / frictionless reuse, and interoperability. Model authors can also request private peer review of their computational models. Models that pass peer review receive a DOI once published.
All users of models published in the library must cite model authors when they use and benefit from their code.
Please check out our model publishing tutorial and feel free to contact us if you have any questions or concerns about publishing your model(s) in the Computational Model Library.
Displaying 10 of 501 results from clear search
RBM - A Relation-based model - a fishery implementation
Nanda Wijermans Maja Schlüter Anja Klein Tilman Hertz | Published Monday, March 17, 2025The Relation-Based Model (RBM) purpose is to operationalise (a form of) process-relational (PR) thinking to serve as a thinking tool for process-relational thinking among social-ecological system (SES) researchers. The development of this model itself has been a ‘Proof of concept’- exercise to see whether we actually represent process-relational thinking in a methodology that is entity-based (ABM).
The target of the agent-based model is to show the emergence, change and disappearance of fishing assemblages (focusing on processes of self-organisation) in a Mexican fishery using a process-relational view. From this view, a fishery is regarded as an assemblage in which fishing can be enabled, fishing can occur, and fish can be bought/sold. These core doings - or sub-assemblages or capacities - maintain the assemblage. Each (sub)assemblage reflects different actualisations of constellations of relations and elements (buyers, fishers, fuel, permits, vessels and wind). The RBM thereby reflects an artificial fishery in which agents (elements) and their links (relations) engage in (enabling) fishing and buying/selling.
Peer reviewed Evolution of Conditional Cooperation in a Spatial Public Goods Game
Marco Janssen Francesca Federico Raksha Balakrishna | Published Saturday, March 15, 2025A model to investigate the Evolution of Conditional Cooperation in a Spatial Public Goods Game. We consider two conditional cooperation strategies: one based on thresholds (Battu & Srinivasan, 2020) and another based on independent decisions for each number of cooperating neighbors. We examine the effects of productivity and conditional cooperation criteria on the trajectory of cooperation. Cooperation is evolving with no need for additional mechanisms apart from spatial structure when agents follow conditional strategies. We confirm the positive influence of productivity and cluster formation on the evolution of cooperation in spatial models. Results are robust for the two types of conditional cooperation strategies.
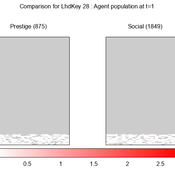
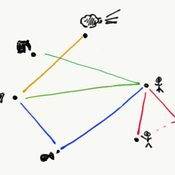
We provide a theory-grounded, socio-geographic agent-based model to present a possible explanation for human movement in the Adriatic region within the Cetina phenomenon.
Focusing on ideas of social capital theory from Piere Bordieu (1986), we implement agent mobility in an abstract geography based on cultural capital (prestige) and social capital (social position). Agents hold myopic representations of social (Schaff, 2016) and geographical networks and decide in a heuristic way on moving (and where) or staying.
The model is implemented in a fork of the Laboratory for Simulation Development (LSD), appended with GIS capabilities (Pereira et. al. 2020).
Soy2Grow-ABM-V1
Siavash Farahbakhsh | Published Monday, January 20, 2025The Soy2Grow ABM aims to simulate the adoption of soybean production in Flanders, Belgium. The model primarily considers two types of agents as farmers: 1) arable and 2) dairy farmers. Each farmer, based on its type, assesses the feasibility of adopting soybean cultivation. The feasibility assessment depends on many interrelated factors, including price, production costs, yield, disease, drought (i.e., environmental stress), social pressure, group formations, learning and skills, risk-taking, subsidies, target profit margins, tolerance to bad experiences, etc. Moreover, after adopting soybean production, agents will reassess their performance. If their performance is unsatisfactory, an agent may opt out of soy production. Therefore, one of the main outcomes to look for in the model is the number of adopters over time.
The main agents are farmers. Generally, factors influencing farmers’ decision-making are divided into seven main areas: 1) external environmental factors, 2) cooperation and learning (with slight differences depending on whether they are arable or dairy farmers), 3) crop-specific factors, 4) economics, 5) support frameworks, 6) behavioral factors, and 7) the role of mobile toasters (applicable only to dairy farmers).
Moreover, factors not only influence decision-making but also interact with each other. Specifically, external environmental factors (i.e., stress) will result in lower yield and quality (protein content). The reducing effect, identified during participatory workshops, can reach 50 %. Skills can grow and improve yield; however, their growth has a limit and follows different learning curves depending on how individualistic a farmer is. During participatory workshops, it was identified that, contrary to cooperative farmers, individualistic farmers may learn faster and reach their limits more quickly. Furthermore, subsidies directly affect revenues and profit margins; however, their impact may disappear when they are removed. In the case of dairy farmers, mobile toasters play an important role, adding toasting and processing costs to those producing soy for their animal feed consumption.
Last but not least, behavioral factors directly influence the final adoption decision. For example, high risk-taking farmers may adopt faster, whereas more conservative farmers may wait for their neighbors to adopt first. Farmers may evaluate their success based on their own targets and may also consider other crops rather than soy.
On the liquidity of the illiquid (hard-to-trade) assets
Marcin Czupryna | Published Monday, January 13, 2025This paper investigates the impact of agents' trading decisions on market liquidity and transactional efficiency in markets for illiquid (hard-to-trade) assets. Drawing on a unique order book dataset from the fine wine exchange Liv-ex, we offer novel insights into liquidity dynamics in illiquid markets. Using an agent-based framework, we assess the adequacy of conventional liquidity measures in capturing market liquidity and transactional efficiency. Our main findings reveal that conventional liquidity measures, such as the number of bids, asks, new bids and new asks, may not accurately represent overall transactional efficiency. Instead, volume (measured by the number of trades) and relative spread measures may be more appropriate indicators of liquidity within the context of illiquid markets. Furthermore, our simulations demonstrate that a greater number of traders participating in the market correlates with an increased efficiency in trade execution, while wider trader-set margins may decrease the transactional efficiency. Interestingly, the trading period of the agents appears to have a significant impact on trade execution. This suggests that granting market participants additional time for trading (for example, through the support of automated trading systems) can enhance transactional efficiency within illiquid markets. These insights offer practical implications for market participants and policymakers aiming to optimise market functioning and liquidity.

Peer reviewed Descriptive Norm and Fraud Dynamics
Alexandra Eckert Matthias Meyer Christian Stindt | Published Tuesday, January 07, 2025 | Last modified Tuesday, March 24, 2026The “Descriptive Norm and Fraud Dynamics” model demonstrates how fraudulent behavior can either proliferate or be contained within non-hierarchical organizations, such as peer networks, through social influence taking the form of a descriptive norm. This model expands on the fraud triangle theory, which posits that an individual must concurrently possess a financial motive, perceive an opportunity, and hold a pro-fraud attitude to engage in fraudulent activities (red agent). In the absence of any of these elements, the individual will act honestly (green agent).
The model explores variations in a descriptive norm mechanism, ranging from local distorted knowledge to global perfect knowledge. In the case of local distorted knowledge, agents primarily rely on information from their first-degree colleagues. This knowledge is often distorted because agents are slow to update their empirical expectations, which are only partially revised after one-to-one interactions. On the other end of the spectrum, local perfect knowledge is achieved by incorporating a secondary source of information into the agents’ decision-making process. Here, accurate information provided by an observer is used to update empirical expectations.
The model shows that the same variation of the descriptive norm mechanism could lead to varying aggregate fraud levels across different fraud categories. Two empirically measured norm sensitivity distributions associated with different fraud categories can be selected into the model to see the different aggregate outcomes.
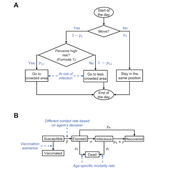
Peer reviewed Behavioral Dynamics of Epidemic Trajectories and Vaccination Strategies: An Agent-Based Model
Ziyuan Zhang | Published Tuesday, December 10, 2024This agent-based model explores the dynamics between human behavior and vaccination strategies during COVID-19 pandemics. It examines how individual risk perceptions influence behaviors and subsequently affect epidemic outcomes in a simulated metropolitan area resembling New York City from December 2020 to May 2021.
Agents modify their daily activities—deciding whether to travel to densely populated urban centers or stay in less crowded neighborhoods—based on their risk perception. This perception is influenced by factors such as risk perception threshold, risk tolerance personality, mortality rate, disease prevalence, and the average number of contacts per agent in crowded settings. Agent characteristics are carefully calibrated to reflect New York City demographics, including age distribution and variations in infection probability and mortality rates across these groups. The agents can experience six distinct health statuses: susceptible, exposed, infectious, recovered from infection, dead, and vaccinated (SEIRDV). The simulation focuses on the Iota and Alpha variants, the dominant strains in New York City during the period.
We simulate six scenarios divided into three main categories:
1. A baseline model without vaccinations where agents exhibit no risk perception and are indifferent to virus transmission and disease prevalence.
…
Peer reviewed Agent-Based Ramsey growth model with Brown and Green capital (ABRam-BG)
Sarah Wolf Aida Sarai Figueroa Alvarez | Published Monday, December 09, 2024The purpose of the ABRam-BG model is to study belief dynamics as a potential driver of green (growth) transitions and illustrate their dynamics in a closed, decentralized economy populated by utility maximizing agents with an environmental attitude. The model is built using the ABRam-T model (for model visit: https://doi.org/10.25937/ep45-k084) and introduces two types of capital – green (low carbon intensity) and brown (high carbon intensity) – with their respective technological progress levels. ABRam-BG simulates a green transition as an emergent phenomenon resulting from well-known opinion dynamics along the economic process.
Peer reviewed AgModel
Isaac Ullah | Published Friday, December 06, 2024AgModel is an agent-based model of the forager-farmer transition. The model consists of a single software agent that, conceptually, can be thought of as a single hunter-gather community (i.e., a co-residential group that shares in subsistence activities and decision making). The agent has several characteristics, including a population of human foragers, intrinsic birth and death rates, an annual total energy need, and an available amount of foraging labor. The model assumes a central-place foraging strategy in a fixed territory for a two-resource economy: cereal grains and prey animals. The territory has a fixed number of patches, and a starting number of prey. While the model is not spatially explicit, it does assume some spatiality of resources by including search times.
Demographic and environmental components of the simulation occur and are updated at an annual temporal resolution, but foraging decisions are “event” based so that many such decisions will be made in each year. Thus, each new year, the foraging agent must undertake a series of optimal foraging decisions based on its current knowledge of the availability of cereals and prey animals. Other resources are not accounted for in the model directly, but can be assumed for by adjusting the total number of required annual energy intake that the foraging agent uses to calculate its cereal and prey animal foraging decisions. The agent proceeds to balance the net benefits of the chance of finding, processing, and consuming a prey animal, versus that of finding a cereal patch, and processing and consuming that cereal. These decisions continue until the annual kcal target is reached (balanced on the current human population). If the agent consumes all available resources in a given year, it may “starve”. Starvation will affect birth and death rates, as will foraging success, and so the population will increase or decrease according to a probabilistic function (perturbed by some stochasticity) and the agent’s foraging success or failure. The agent is also constrained by labor caps, set by the modeler at model initialization. If the agent expends its yearly budget of person-hours for hunting or foraging, then the agent can no longer do those activities that year, and it may starve.
Foragers choose to either expend their annual labor budget either hunting prey animals or harvesting cereal patches. If the agent chooses to harvest prey animals, they will expend energy searching for and processing prey animals. prey animals search times are density dependent, and the number of prey animals per encounter and handling times can be altered in the model parameterization (e.g. to increase the payoff per encounter). Prey animal populations are also subject to intrinsic birth and death rates with the addition of additional deaths caused by human predation. A small amount of prey animals may “migrate” into the territory each year. This prevents prey animals populations from complete decimation, but also may be used to model increased distances of logistic mobility (or, perhaps, even residential mobility within a larger territory).
…
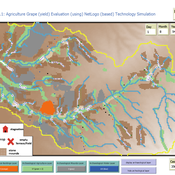
Peer reviewed Agriculture.Grape.yield.Evaluation.using.NetLogo.based.Technology.Simulation (AGENTS): A NetLogo agent-based model developed to assess viticulture efficiency in Byzantine Shivta.
Barak Garty Gil Gambash Guy BarOz Sharona T Levy | Published Friday, December 06, 2024AGENTS model is an agent-based computational framework designed to explore the socio-ecological and economic dynamics of agricultural production in the Byzantine Negev Highlands, with a focus on viticulture. It integrates historical, environmental, and social factors to simulate settlement sustainability, crop yields, and the impacts of varying climate conditions. The model is built in NetLogo and incorporates GIS-based topographical and hydrological data. Key features include the ability to assess climate impacts on crop profitability and settlement strategies, evaluate economic outputs of ancient vineyards, and simulate agent decision-making processes under diverse scenarios.
The AGENTS model is highly flexible, enabling users to simulate agricultural regimes with any two crops: one cash crop (a crop grown for profit, e.g., grapevines) and one staple crop (a crop grown for subsistence, e.g., wheat). While the default setup models viticulture and wheat cultivation in the Byzantine Negev Highlands, users can adapt the model to different environmental and socio-ecological contexts worldwide—both past and present.
Users can load external files to customize precipitation, evaporation, topography, and labor costs (measured as man-days per 0.1ha, converted to kg of wheat per model patch size area), and can also edit key parameters related to yield calculations. This includes modifying crop-specific yield formulas, soil and runoff indices, and any factors influencing crop performance. The model inherently simulates cash crops grown in floodplain regions and staple crops cultivated along riverbanks, providing a powerful tool to investigate societal resilience and responses to climate stressors across diverse environments.
…
Displaying 10 of 501 results from clear search