Our mission is to help computational modelers develop, document, and share their computational models in accordance with community standards and good open science and software engineering practices. Model authors can publish their model source code in the Computational Model Library with narrative documentation as well as metadata that supports open science and emerging norms that facilitate software citation, computational reproducibility / frictionless reuse, and interoperability. Model authors can also request private peer review of their computational models. Models that pass peer review receive a DOI once published.
All users of models published in the library must cite model authors when they use and benefit from their code.
Please check out our model publishing tutorial and feel free to contact us if you have any questions or concerns about publishing your model(s) in the Computational Model Library.
Displaying 10 of 120 results random clear search
Peer reviewed Behavioral Dynamics of Epidemic Trajectories and Vaccination Strategies: An Agent-Based Model
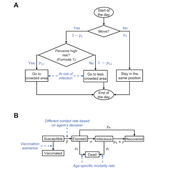
Ziyuan Zhang | Published Tuesday, December 10, 2024This agent-based model explores the dynamics between human behavior and vaccination strategies during COVID-19 pandemics. It examines how individual risk perceptions influence behaviors and subsequently affect epidemic outcomes in a simulated metropolitan area resembling New York City from December 2020 to May 2021.
Agents modify their daily activities—deciding whether to travel to densely populated urban centers or stay in less crowded neighborhoods—based on their risk perception. This perception is influenced by factors such as risk perception threshold, risk tolerance personality, mortality rate, disease prevalence, and the average number of contacts per agent in crowded settings. Agent characteristics are carefully calibrated to reflect New York City demographics, including age distribution and variations in infection probability and mortality rates across these groups. The agents can experience six distinct health statuses: susceptible, exposed, infectious, recovered from infection, dead, and vaccinated (SEIRDV). The simulation focuses on the Iota and Alpha variants, the dominant strains in New York City during the period.
We simulate six scenarios divided into three main categories:
1. A baseline model without vaccinations where agents exhibit no risk perception and are indifferent to virus transmission and disease prevalence.
…
Simple models with different types of complexity
Michael Roos | Published Tuesday, September 17, 2024 | Last modified Saturday, March 01, 2025Hierarchical problem-solving model
The model simulates a hierarchical problem-solving process in which a manager delegates parts of a problem to specialists, who attempt to solve specific aspects based on their unique skills. The goal is to examine how effectively the hierarchical structure works in solving the problem, the total cost of the process, and the resulting solution quality.
Problem-solving random network model
The model simulates a network of agents (generalists) who collaboratively solve a fixed problem by iterating over it and using their individual skills to reduce the problem’s complexity. The goal is to study the dynamics of the problem-solving process, including agent interactions, work cycles, total cost, and solution quality.
Shellmound Trade
Henrique de Sena Kozlowski | Published Saturday, June 15, 2024This model simulates different trade dynamics in shellmound (sambaqui) builder communities in coastal Southern Brazil. It features two simulation scenarios, one in which every site is the same and another one testing different rates of cooperation. The purpose of the model is to analyze the networks created by the trade dynamics and explore the different ways in which sambaqui communities were articulated in the past.
How it Works?
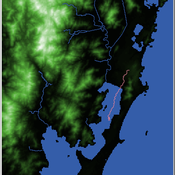
There are a few rules operating in this model. In either mode of simulation, each tick the agents will produce an amount of resources based on the suitability of the patches inside their occupation-radius, after that the procedures depend on the trade dynamic selected. For BRN? the agents will then repay their owed resources, update their reputation value and then trade again if they need to. For GRN? the agents will just trade with a connected agent if they need to. After that the agents will then consume a random amount of resources that they own and based on that they will grow (split) into a new site or be removed from the simulation. The simulation runs for 1000 ticks. Each patch correspond to a 300x300m square of land in the southern coast of Santa Catarina State in Brazil. Each agent represents a shellmound (sambaqui) builder community. The data for the world were made from a SRTM raster image (1 arc-second) in ArcMap. The sites can be exported into a shapefile (.shp) vector to display in ArcMap. It uses a UTM Sirgas 2000 22S projection system.
Shellmound Mobility
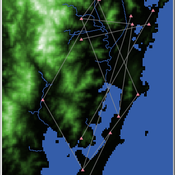
Henrique de Sena Kozlowski | Published Saturday, June 15, 2024Least Cost Path (LCP) analysis is a recurrent theme in spatial archaeology. Based on a cost of movement image, the user can interpret how difficult it is to travel around in a landscape. This kind of analysis frequently uses GIS tools to assess different landscapes. This model incorporates some aspects of the LCP analysis based on GIS with the capabilities of agent-based modeling, such as the possibility to simulate random behavior when moving. In this model the agent will travel around the coastal landscape of Southern Brazil, assessing its path based on the different cost of travel through the patches. The agents represent shellmound builders (sambaquieiros), who will travel mainly through the use of canoes around the lagoons.
How it works?
When the simulation starts the hiker agent moves around the world, a representation of the lagoon landscape of the Santa Catarina state in Southern Brazil. The agent movement is based on the travel cost of each patch. This travel cost is taken from a cost surface raster created in ArcMap to represent the different cost of movement around the landscape. Each tick the agent will have a chance to select the best possible patch to move in its Field of View (FOV) that will take it towards its target destination. If it doesn’t select the best possible patch, it will randomly choose one of the patches to move in its FOV. The simulation stops when the hiker agent reaches the target destination. The elevation raster file and the cost surface map are based on a 1 Arc-second (30m) resolution SRTM image, scaled down 5 times. Each patch represents a square of 150m, with an area of 0,0225km². The dataset uses a UTM Sirgas 2000 22S projection system. There are four different cost functions available to use. They change the cost surface used by the hikers to navigate around the world.
Peer reviewed Historical Letters
Bernardo Buarque Malte Vogl Jascha Merijn Schmitz Aleksandra Kaye | Published Thursday, May 16, 2024 | Last modified Friday, May 24, 2024A letter sending model with historically informed initial positions to reconstruct communication and archiving processes in the Republic of Letters, the 15th to 17th century form of scholarship.
The model is aimed at historians, willing to formalize historical assumptions about the letter sending process itself and allows in principle to set heterogeneous social roles, e.g. to evaluate the role of gender or social status in the formation of letter exchange networks. The model furthermore includes a pruning process to simulate the loss of letters to critically asses the role of biases e.g. in relation to gender, geographical regions, or power structures, in the creation of empirical letter archives.
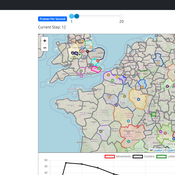
Each agent has an initial random topic vector, expressed as a RGB value. The initial positions of the agents are based on a weighted random draw based on data from [2]. In each step, agents generate two neighbourhoods for sending letters and potential targets to move towards. The probability to send letters is a self-reinforcing process. After each sending the internal topic of the receiver is updated as a movement in abstract space by a random amount towards the letters topic.
…
Agent-based tax evasion model for investigating impacts of public disclosure
Hiroyuki Sano | Published Thursday, March 14, 2024The model explores the impact of public disclosure on tax compliance among diverse agents, including individual taxpayers and a tax authority. It incorporates heterogeneous preferences and income endowments among taxpayers, captured through a utility function that considers psychic costs subtracted from expected pecuniary utility. These costs include moral, reciprocity, and stigma costs associated with norm violations, leading to variations in taxpayers’ risk attitudes and related parameters. The tax authority’s attributes, such as the frequency of random audits, penalty rate, and the choice between partial or full disclosure, remain fixed throughout the simulation. Income endowments and preference parameters are randomly assigned to taxpayers at the outset.
Taxpayers maximize their expected utility by reporting income, taking into account tax, penalty, and audit rates. They make annual decisions based on their own and their peers’ behaviors from the previous year. Taxpayers indirectly interact at the societal level through public disclosure conducted by the tax authority, exchanging tax information among peers. Each period in the simulation collects data on total reported income, average compliance rates per income group, distribution of compliance rates, counts of compliers, full evaders, partial evaders, and the numbers of taxpayers experiencing guilt and anger. The model evaluates whether public disclosure positively or negatively impacts compliance rates and quantifies this impact based on aggregated individual reporting behaviors.

Role of Diversity in Team Performance: the Case of Missing Expertise, an Agent Based Simulations
Tamás Kiss | Published Friday, December 29, 2023This ABM simulates problem solving agents as they work on a set of tasks. Each agent has a trait vector describing their skills. Two agents might form a collaboration if their traits are similar enough. Tasks are defined by a component vector. Agents work on tasks by decreasing tasks’ component vectors towards zero.
The simulation generates agents with given intrapersonal functional diversity (IFD), and dominant function diversity (DFD), and a set of random tasks and evaluates how agents’ traits influence their level of communication and the performance of a team of agents.
Modeling results highlight the importance of the distributions of agents’ properties forming a team, and suggests that for a thorough description of management teams, not only diversity measures based on individual agents, but an aggregate measure is also required.
…
Peer reviewed A Bayesian Nash Equilibrium (BNE)-informed ABM for pedestrian evacuation in different constricted spaces
Jiaqi Ge Yiyu Wang Alexis Comber | Published Wednesday, October 11, 2023This BNE-informed ABM ultimately aims to provide a more realistic description of complicated pedestrian behaviours especially in high-density and life-threatening situations. Bayesian Nash Equilibrium (BNE) was adopted to reproduce interactive decision-making process among rational and game-playing agents. The implementations of 3 behavioural models, which are Shortest Route (SR) model, Random Follow (RF) model, and BNE model, make it possible to simulate emergent patterns of pedestrian behaviours (e.g. herding and self-organised queuing behaviours, etc.) in emergency situations.
According to the common features of previous mass trampling accidents, a series of simulation experiments were performed in space with 3 types of barriers, which are Horizontal Corridors, Vertical Corridors, and Random Squares, standing for corridors, bottlenecks and intersections respectively, to investigate emergent behaviours of evacuees in varied constricted spatial environments. The output of this ABM has been available at https://data.mendeley.com/datasets/9v4byyvgxh/1.
Correlated random walk (Javascript)
Viktoriia Radchuk Uta Berger Thibault Fronville | Published Tuesday, May 09, 2023The first simple movement models used unbiased and uncorrelated random walks (RW). In such models of movement, the direction of the movement is totally independent of the previous movement direction. In other words, at each time step the direction, in which an individual is moving is completely random. This process is referred to as a Brownian motion.
On the other hand, in correlated random walks (CRW) the choice of the movement directions depends on the direction of the previous movement. At each time step, the movement direction has a tendency to point in the same direction as the previous one. This movement model fits well observational movement data for many animal species.
The presented agent based model simulated the movement of the agents as a correlated random walk (CRW). The turning angle at each time step follows the Von Mises distribution with a ϰ of 10. The closer ϰ gets to zero, the closer the Von Mises distribution becomes uniform. The larger ϰ gets, the more the Von Mises distribution approaches a normal distribution concentrated around the mean (0°).
In this script the turning angles (following the Von Mises distribution) are generated based on the the instructions from N. I. Fisher 2011.
This model is implemented in Javascript and can be used as a building block for more complex agent based models that would rely on describing the movement of individuals with CRW.
Peer reviewed Correlated Random Walk (NetLogo)
Viktoriia Radchuk Uta Berger Thibault Fronville | Published Tuesday, May 09, 2023 | Last modified Monday, December 18, 2023This is NetLogo code that presents two alternative implementations of Correlated Random Walk (CRW):
- 1. drawing the turning angles from the uniform distribution, i.e. drawing the angle with the same probability from a certain given range;
- 2. drawing the turning angles from von Mises distribution.
The move lengths are drawn from the lognormal distribution with the specified parameters.
Correlated Random Walk is used to represent the movement of animal individuals in two-dimensional space. When modeled as CRW, the direction of movement at any time step is correlated with the direction of movement at the previous time step. Although originally used to describe the movement of insects, CRW was later shown to sufficiently well describe the empirical movement data of other animals, such as wild boars, caribous, sea stars.
…
Displaying 10 of 120 results random clear search