About the CoMSES Model Library more info
Our mission is to help computational modelers develop, document, and share their computational models in accordance with community standards and good open science and software engineering practices. Model authors can publish their model source code in the Computational Model Library with narrative documentation as well as metadata that supports open science and emerging norms that facilitate software citation, computational reproducibility / frictionless reuse, and interoperability. Model authors can also request private peer review of their computational models. Models that pass peer review receive a DOI once published.
All users of models published in the library must cite model authors when they use and benefit from their code.
Please check out our model publishing tutorial and feel free to contact us if you have any questions or concerns about publishing your model(s) in the Computational Model Library.
We also maintain a curated database of over 7500 publications of agent-based and individual based models with detailed metadata on availability of code and bibliometric information on the landscape of ABM/IBM publications that we welcome you to explore.
Displaying 10 of 1115 results for "A Flache" clear search
Viability analysis of a population submitted to floods
Sophie Martin | Published Wednesday, September 22, 2021This model computes the guaranteed viability kernel of a model describing the evolution of a population submitted to successive floods.
The population is described by its wealth and its adaptation rate to floods, the control are information campaigns that have a cost but increase the adaptation rate and the expected successive floods belong to given set defined by the maximal high and the minimal time between two floods.
Communication and Trust in a Commons Dilemma Experiment
Marco Janssen | Published Sunday, October 02, 2022An agent model is presented that aims to capture the impact of cheap talk on collective action in a commons dilemma. The commons dilemma is represented as a spatially explicit renewable resource. Agent’s trust in others impacts the speed and harvesting rate, and trust is impacted by observed harvesting behavior and cheap talk. We calibrated the model using experimental data (DeCaro et al. 2021). The best fit to the data consists of a population with a small frequency of altruistic and selfish agents, and mostly conditional cooperative agents sensitive to inequality and cheap talk. This calibrated model provides an empirical test of the behavioral theory of collective action of Elinor Ostrom and Humanistic Rational Choice Theory.
Emergency Warning Dissemination in a Multiplex Social Network
Charles Koll | Published Tuesday, January 31, 2023This is an interdisciplinary agent-based model with Monte Carlo simulations to assess the relative effects of broadcast and contagion processes in a multiplex social network. This multiplex approach models multiple channels of informal communication - phone, word-of-mouth, and social media - that vary in their attribute values. Each agent is an individual in a threatened community who, once warned, has a probability of warning others in their social network using one of these channels. The probability of an individual warning others is based on their warning source and the time remaining until disaster impact, among other variables. Default parameter values were chosen from empirical studies of disaster warnings along with the spatial aspects of Coos Bay, OR, USA and Seaside, OR, USA communities.
Portfolio Optimization and Trading Strategies: a simulation approach
Alessio Emanuele Biondo Laura Mazzarino | Published Sunday, March 20, 2022This model analyzes two investors forming their expectations with heterogeneous strategies in order to optimize their portfolios by means of a Sharpe ratio maximization. Traders are distinguished according to their methodology used in forecasting. Two acknowledged algorithms of technical analysis have been implemented to compare portfolios performances and assess profitability of each technique.
Model of communication between two groups of managers in the course of project implementation
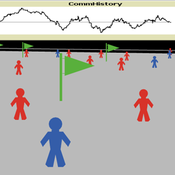
Smarzhevskiy Ivan | Published Monday, December 07, 2020This is a simulation model of communication between two groups of managers in the course of project implementation. The “world” of the model is a space of interaction between project participants, each of which belongs either to a group of work performers or to a group of customers. Information about the progress of the project is publicly available and represents the deviation Earned value (EV) from the planned project value (cost baseline).
The key elements of the model are 1) persons belonging to a group of customers or performers, 2) agents that are communication acts. The life cycle of persons is equal to the time of the simulation experiment, the life cycle of the communication act is 3 periods of model time (for the convenience of visualizing behavior during the experiment). The communication act occurs at a specific point in the model space, the coordinates of which are realized as random variables. During the experiment, persons randomly move in the model space. The communication act involves persons belonging to a group of customers and a group of performers, remote from the place of the communication act at a distance not exceeding the value of the communication radius (MaxCommRadius), while at least one representative from each of the groups must participate in the communication act. If none are found, the communication act is not carried out. The number of potential communication acts per unit of model time is a parameter of the model (CommPerTick).
The managerial sense of the feedback is the stimulating effect of the positive value of the accumulated communication complexity (positive background of the project implementation) on the productivity of the performers. Provided there is favorable communication (“trust”, “mutual understanding”) between the customer and the contractor, it is more likely that project operations will be performed with less lag behind the plan or ahead of it.
The behavior of agents in the world of the model (change of coordinates, visualization of agents’ belonging to a specific communicative act at a given time, etc.) is not informative. Content data are obtained in the form of time series of accumulated communicative complexity, the deviation of the earned value from the planned value, average indicators characterizing communication - the total number of communicative acts and the average number of their participants, etc. These data are displayed on graphs during the simulation experiment.
The control elements of the model allow seven independent values to be varied, which, even with a minimum number of varied values (three: minimum, maximum, optimum), gives 3^7 = 2187 different variants of initial conditions. In this case, the statistical processing of the results requires repeated calculation of the model indicators for each grid node. Thus, the set of varied parameters and the range of their variation is determined by the logic of a particular study and represents a significant narrowing of the full set of initial conditions for which the model allows simulation experiments.
…
A Multi-Agent Simulation Approach to Farmland Auction Markets
James Nolan | Published Wednesday, June 22, 2011 | Last modified Saturday, April 27, 2013This model explores the effects of agent interaction, information feedback, and adaptive learning in repeated auctions for farmland. It gathers information for three types of sealed-bid auctions, and one English auction and compares the auctions on the basis of several measures, including efficiency, price information revelation, and ability to handle repeated bidding and agent learning.
A modified model of breeding synchrony in colonial birds
James Millington | Published Tuesday, June 26, 2012 | Last modified Saturday, April 27, 2013This generic individual-based model of a bird colony shows how the influence neighbour’s stress levels synchronize the laying date of neighbours and also of large colonies. The model has been used to demonstrate how this form of simulation model can be recognised as being ‘event-driven’, retaining a history in the patterns produced via simulated events and interactions.
A land-use model to illustrate ambiguity in design
Julia Schindler | Published Monday, October 15, 2012 | Last modified Friday, January 13, 2017This is an agent-based model that allows to test alternative designs for three model components. The model was built using the LUDAS design strategy, while each alternative is in line with the strategy. Using the model, it can be shown that alternative designs, though built on the same strategy, lead to different land-use patterns over time.
Interplay between stakeholders of the management of a river
Christophe Sibertin-Blanc Pascal Roggero Bertrand Baldet | Published Wednesday, November 12, 2014This model describes and analyses the outcomes of the confrontation of interests, some conflicting, some common, about the management of a small river in SW France
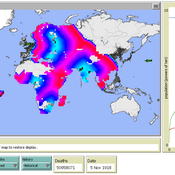
A Modelling4All/NetLogo model of the Spanish Flu Pandemic
Ken Kahn | Published Monday, August 05, 2013 | Last modified Monday, August 05, 2013A global model of the 1918-19 Influenza Pandemic. It can be run to match history or explore counterfactual questions about the influence of World War I on the dynamics of the epidemic. Explores two theories of the location of the initial infection.
Displaying 10 of 1115 results for "A Flache" clear search
