Our mission is to help computational modelers develop, document, and share their computational models in accordance with community standards and good open science and software engineering practices. Model authors can publish their model source code in the Computational Model Library with narrative documentation as well as metadata that supports open science and emerging norms that facilitate software citation, computational reproducibility / frictionless reuse, and interoperability. Model authors can also request private peer review of their computational models. Models that pass peer review receive a DOI once published.
All users of models published in the library must cite model authors when they use and benefit from their code.
Please check out our model publishing tutorial and feel free to contact us if you have any questions or concerns about publishing your model(s) in the Computational Model Library.
Displaying 10 of 61 results movement clear search
Peer reviewed Agent-Based Model of Avian Movement and Functional Connectivity in Bogotá: Evaluating the 'Media Luna del Sur' Ecological Corridor (POT 2022–2035)
Maria Emilia Pelaez De Los Rios | Published Monday, September 14, 2026This NetLogo model simulates the movement and foraging behavior of 20 bird species (classified as urban avoiders or utilizers) across a 20×20m grid landscape representing southern Bogotá, Colombia. Agents follow an optimal foraging strategy (90% of the time) or move randomly (10%), gaining energy from land-cover-dependent food sources and dying if energy falls below their basal metabolic rate. The model compares two landscape scenarios — current land cover (2016) and a proposed scenario incorporating the ‘Media Luna del Sur’ ecological corridor from Bogotá’s 2022–2035 Land Use Plan (POT) — to evaluate whether the proposed green infrastructure improves functional connectivity for avian biodiversity across the urban matrix. Outputs include cumulative patch visitation counts, exported as raster files, used to generate connectivity heatmaps.
Modelling the effects of mowing regimes on arthropod abundance in grasslands of Lüneburg
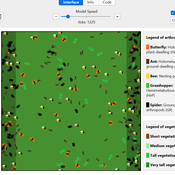
Johanna Augustin Joanna-173 | Published Tuesday, August 25, 2026This NetLogo model simulates the impact of mowing frequency, mower type and the percentage of refuge strips on the abundance of arthropods in managed grasslands. It represents five functional arthropod groups: holometabolous plant-dwelling arthropods (HoP, represented by butterflies); holometabolous ground-dwelling arthropods (HoG, represented by ants); nesting pollinators (NP, represented by bees); hemimetabolous plant-dwelling arthropods (HeP, represented by grasshoppers); and ground-resident arthropods (GR, represented by spiders). Three mowing frequencies are simulated: intensive (four mowings per year), intermediate (two mowings per year) and extensive (one mowing per year). Bar and disc mowers differ in their effects on arthropod mortality and vegetation height. Refuge strip coverage can be set to 0%, 10% or 20%. Arthropod abundance changes over time through movement, reproduction, natural mortality, mower-related mortality and vegetation regrowth.
Agent modeling (ABM) as a tool to improve the mobility of “avoidant” birds in an ecological corridor in the localities of Chapinero, Teusaquillo, Barrios Unidos and Engativá of Bogotá city [Scenario 2]
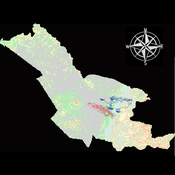
Paula Alejandra Meza | Published Thursday, June 25, 2026Considering that two of the three avoider species could not reach the target area in the inittial scenario, five alternative corridor scenarios were created. In all cases, we generated a greater amount of cover area under ‘Urban forest’, including elements such as scattered trees, woody plants, wooded areas, and rows of trees. This covered type was selected since all three species use it as a regular habitat. That is the second sceneario where those ecological parks and other areas inside the capital city were boostered into “urban forest patches” or buffer points, with the idea of improving the survive of the three bird species and their movement. However one of the most restrictive specie was still having movement and survival issues.
Agent modeling (ABM) as a tool to improve the mobility of “avoidant” birds in an ecological corridor in the localities of Chapinero, Teusaquillo, Barrios Unidos and Engativá of Bogotá city
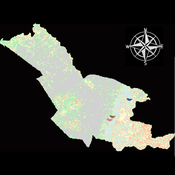
Paula Alejandra Meza Maria Angela Echeverry-Galvis Mauricio González Méndez | Published Wednesday, June 24, 2026The purpose of this model is to analyze different configurations and scenarios of ecological corridors to simulate the movement of three avoider bird species at a local scale: Chondrohierax uncinatus (Accipitridae), a large carnivorous bird; Ampelion rubrocristatus (Cotingidae), a species that seeks areas with substantial land cover for refuge and rest; and Coeligena bonapartei (Trochilidae), a large hummingbird that prefers areas with a rich and diverse food supply. The model focusses on juvenile bird individuals seeking refuge and food, taking into account the mobility parameters of each species and the existing land cover types within the study area.
Specifically, the model aims to:
• Simulate the movement of 45 avoiders birds which are considered umbrella species sensitive to urban changes (which were chosen based on their specific biological and ecological requirements and parameters relevant to urban conservation efforts), 15 avoiders birds per specie to cross a two-dimensional world predominant urban.
• To be able to select which corridor scenario would be the most beneficial, in order to help the mobility of other species affected by urban fragmentation.
• Contribute to urban ecology research and support decision-making processes by relevant stakeholders.
Aquarium
Yunshuo Tang | Published Tuesday, May 26, 2026This model simulates a simple aquatic ecosystem containing fish and food. It explores how individual interactions such as movement, feeding, and reproduction shape the population dynamics of fish over time.
Peer reviewed Gradient Descent Simulation
Ilyes Azouani | Published Wednesday, March 18, 2026 | Last modified Monday, May 25, 2026This model visualizes gradient descent optimization - the fundamental algorithm used to train neural networks and other machine learning models. Agents represent different optimization algorithms searching for the minimum of a loss landscape (the “error surface” that ML models try to minimize during training).
The model demonstrates how different optimizer types (SGD, Momentum with different parameters) behave on various loss landscapes, from simple bowls to the notoriously difficult Rosenbrock “banana valley” function. This helps build intuition about why certain optimization algorithms work better than others for different problem geometries.
HOW IT WORKS
…
Exploring the aftermath of transition failures: An agent-based model
Gangmin Park Junmin Lee Jisoo Lee Keungoui Kim | Published Friday, March 06, 2026This computational model is an agent-based model (ABM) developed to investigate how repeated failures of emerging niches accumulate and influence the trajectory of socio-technical transitions. Built in AnyLogic 8.7.11, the model simulates the dynamic interactions between a dominant regime and sequential niche entrants within a two-dimensional practice space. It models alignment, movement, and competition based on technological maturity and market penetration. The model utilizes a reinforcing feedback structure linking consumer support, output, resource accumulation, and capacity development (Physical and Institutional Capacity). A complete model specification following the ODD+D (Overview, Design concepts, Details, and Decision) protocol is included in the documentation.
Peer reviewed MicroAnts 2.5
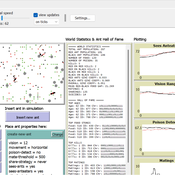
Diogo Alves | Published Thursday, October 16, 2025MicroAnts 2.5 is a general-purpose agent-based model designed as a flexible workhorse for simulating ecological and evolutionary dynamics in artificial populations, as well as, potentially, the emergence of political institutions and economic regimes. It builds on and extends Stephen Wright’s original MicroAnts 2.0 by introducing configurable predators, inequality tracking, and other options.
Ant agents are of two tyes/casts and controlled by 16-bit chromosomes encoding traits such as vision, movement, mating thresholds, sensing, and combat strength. Predators (anteaters) operate in static, random, or targeted predatory modes. Ants reproduce, mutate, cooperate, fight, and die based on their traits and interactions. Environmental pressures (poison and predators) and social dynamics (sharing, mating, combat) drive emergent behavior across red and black ant populations.
The model supports insertion of custom agents at runtime, configurable mutation/inversion rates, and exports detailed statistics, including inequality metrics (e.g., Gini coefficients), trait frequencies, predator kills, and lineage data. Intended for rapid testing and educational experimentation, MicroAnts 2.5 serves as a modular base for more complex ecological and social simulations.
Urban Teacher Lifecycle and Mobility
Yevgeny Patarakin | Published Wednesday, July 23, 2025This agent-based model simulates the lifecycle, movement, and satisfaction of teachers within an urban educational system composed of multiple universities and schools. Each teacher agent transitions through several possible roles: newcomer, university student, unemployed graduate, and employed teacher. Teachers’ pathways are shaped by spatial configuration, institutional capacities, individual characteristics, and dynamic interactions with schools and universities. Universities are assigned spatial locations with a controllable level of centralization and are characterized by academic ratings, capacity, and alumni records. Schools are distributed throughout the city, each with a limited number of vacancies, hiring requirements, and offered salaries. Teachers apply to universities based on the alignment of their personal academic profiles with institutional ratings, pursue studies, and upon graduation become candidates for employment at schools.
The employment process is driven by a decentralized matching of teacher expectations and school offers, taking into account factors such as salary, proximity, and peer similarity. Teachers’ satisfaction evolves over time, reflecting both institutional characteristics and the composition of their colleagues; low satisfaction may prompt teachers to transfer between schools within their mobility radius. Mortality and teacher attrition further shape workforce dynamics, leading to continuous recruitment of newcomers to maintain a stable population. The model tracks university reputation through the academic performance and number of alumni, and visualizes key metrics including teacher status distribution, school staffing, university alumni counts, and overall satisfaction. This structure enables the exploration of policy interventions, hiring and training strategies, and the impact of spatial and institutional design on the allocation, retention, and happiness of urban educational staff.
We provide a theory-grounded, socio-geographic agent-based model to present a possible explanation for human movement in the Adriatic region within the Cetina phenomenon.
Focusing on ideas of social capital theory from Piere Bordieu (1986), we implement agent mobility in an abstract geography based on cultural capital (prestige) and social capital (social position). Agents hold myopic representations of social (Schaff, 2016) and geographical networks and decide in a heuristic way on moving (and where) or staying.
The model is implemented in a fork of the Laboratory for Simulation Development (LSD), appended with GIS capabilities (Pereira et. al. 2020).
Displaying 10 of 61 results movement clear search