About the CoMSES Model Library more info
Our mission is to help computational modelers at all levels engage in the establishment and adoption of community standards and good practices for developing and sharing computational models. Model authors can freely publish their model source code in the Computational Model Library alongside narrative documentation, open science metadata, and other emerging open science norms that facilitate software citation, reproducibility, interoperability, and reuse. Model authors can also request peer review of their computational models to receive a DOI.
All users of models published in the library must cite model authors when they use and benefit from their code.
Please check out our model publishing tutorial and contact us if you have any questions or concerns about publishing your model(s) in the Computational Model Library.
We also maintain a curated database of over 7500 publications of agent-based and individual based models with additional detailed metadata on availability of code and bibliometric information on the landscape of ABM/IBM publications that we welcome you to explore.
Displaying 10 of 129 results for "Emily S Ihara" clear search
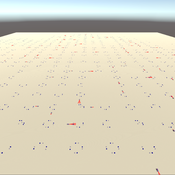
3D Urban Traffic Simulator (ABM) in Unity
Daniel Birks Sedar Olmez Obi Thompson Sargoni Alison Heppenstall Annabel Whipp Ed Manley | Published Friday, January 22, 2021 | Last modified Monday, March 22, 2021The Urban Traffic Simulator is an agent-based model developed in the Unity platform. The model allows the user to simulate several autonomous vehicles (AVs) and tune granular parameters such as vehicle downforce, adherence to speed limits, top speed in mph and mass. The model allows researchers to tune these parameters, run the simulator for a given period and export data from the model for analysis (an example is provided in Jupyter Notebook).
The data the model is currently able to output are the following:
…
Peer reviewed BAM: The Bottom-up Adaptive Macroeconomics Model
Alejandro Platas López Alejandro Guerra-Hernández | Published Tuesday, January 14, 2020 | Last modified Sunday, July 26, 2020Overview
Purpose
Modeling an economy with stable macro signals, that works as a benchmark for studying the effects of the agent activities, e.g. extortion, at the service of the elaboration of public policies..
…
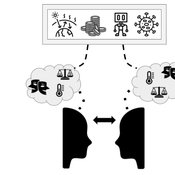
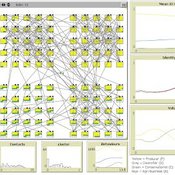
Peer reviewed Dynamic Value-based Cognitive Architectures
Bart de Bruin | Published Tuesday, November 30, 2021The intention of this model is to create an universal basis on how to model change in value prioritizations within social simulation. This model illustrates the designing of heterogeneous populations within agent-based social simulations by equipping agents with Dynamic Value-based Cognitive Architectures (DVCA-model). The DVCA-model uses the psychological theories on values by Schwartz (2012) and character traits by McCrae and Costa (2008) to create an unique trait- and value prioritization system for each individual. Furthermore, the DVCA-model simulates the impact of both social persuasion and life-events (e.g. information, experience) on the value systems of individuals by introducing the innovative concept of perception thermometers. Perception thermometers, controlled by the character traits, operate as buffers between the internal value prioritizations of agents and their external interactions. By introducing the concept of perception thermometers, the DVCA-model allows to study the dynamics of individual value prioritizations under a variety of internal and external perturbations over extensive time periods. Possible applications are the use of the DVCA-model within artificial sociality, opinion dynamics, social learning modelling, behavior selection algorithms and social-economic modelling.
MCA-SdA (ABM of mining-community-aquifer interactions in Salar de Atacama, Chile)
Wenjuan Liu | Published Tuesday, December 01, 2020 | Last modified Thursday, November 04, 2021This model represnts an unique human-aquifer interactions model for the Li-extraction in Salar de Atacama, Chile. It describes the local actors’ experience of mining-induced changes in the socio-ecological system, especially on groundwater changes and social stressors. Social interactions are designed specifically according to a long-term local fieldwork by Babidge et al. (2019, 2020). The groundwater system builds on the FlowLogo model by Castilla-Rho et al. (2015), which was then parameterized and calibrated with local hydrogeological inputs in Salar de Atacama, Chile. The social system of the ABM is defined and customozied based on empirical studies to reflect three major stressors: drought stress, population stress, and mining stress. The model reports evolution of groundwater changes and associated social stress dynamics within the modeled time frame.
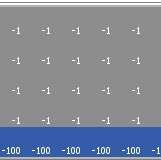
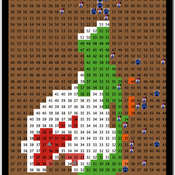
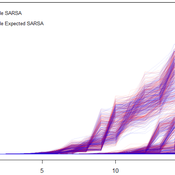
Cliff Walking with Q-Learning NetLogo Extension
Kevin Kons Fernando Santos | Published Tuesday, December 10, 2019This model implements a classic scenario used in Reinforcement Learning problem, the “Cliff Walking Problem”. Consider the gridworld shown below (SUTTON; BARTO, 2018). This is a standard undiscounted, episodic task, with start and goal states, and the usual actions causing movement up, down, right, and left. Reward is -1 on all transitions except those into the region marked “The Cliff.” Stepping into this region incurs a reward of -100 and sends the agent instantly back to the start (SUTTON; BARTO, 2018).
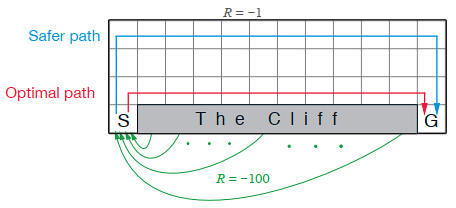
The problem is solved in this model using the Q-Learning algorithm. The algorithm is implemented with the support of the NetLogo Q-Learning Extension
Exploring social psychology theory for modelling farmer decision-making
James Millington | Published Tuesday, September 18, 2012 | Last modified Saturday, April 27, 2013To investigate the potential of using Social Psychology Theory in ABMs of natural resource use and show proof of concept, we present an exemplary agent-based modelling framework that explicitly represents multiple and hierarchical agent self-concepts
Cumulative effects agent-based model of forestry and hunting
Scott Heckbert | Published Friday, December 04, 2009 | Last modified Saturday, April 27, 2013This NetLogo model represents hunters and forestry road development in a spatial landscape. The cumulative effects of multiple resource use is explored.
Cumulative effects agent-based model of forestry and hunting
Scott Heckbert | Published Friday, December 04, 2009 | Last modified Saturday, April 27, 2013A special case of the model ‘huntingforestry’, where a ‘pulsar’ pattern emerges, balancing hunting and game population growth.
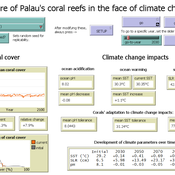
Development of coral reefs under climate change impacts and adaptation options
Nina Preußler | Published Friday, May 30, 2025This NetLogo model simulates how coral reefs around the islands of Palau would develop under different emission scenarios and with selected adaptation strategies. Reef health is indicated by coral cover (%) and is affected by four major climate change impacts: increasing sea surface temperature, sea level rise, ocean acidification, and more intense typhoons. The model differentiates between inner and outer reefs, with the former naturally adapted to warmer, more acidic waters. The simulation includes bleaching events and possible recovery. In addition, the user can choose between different coral transplantation strategies as well as regulate natural thermal adaptation rates.
FlipFlop1-ProMEERB: A coupled social-ecological model with a promotional mechanism for emergence of environmentally responsible behavior
Liliana Perez Saeed Harati Roberto Molowny-Horas | Published Friday, December 17, 2021At the heart of a study of Social-Ecological Systems, this model is built by coupling together two independently developed models of social and ecological phenomena. The social component of the model is an abstract model of interactions of a governing agent and several user agents, where the governing agent aims to promote a particular behavior among the user agents. The ecological model is a spatial model of spread of the Mountain Pine Beetle in the forests of British Columbia, Canada. The coupled model allowed us to simulate various hypothetical management scenarios in a context of forest insect infestations. The social and ecological components of this model are developed in two different environments. In order to establish the connection between those components, this model is equipped with a ‘FlipFlop’ - a structure of storage directories and communication protocols which allows each of the models to process its inputs, send an output message to the other, and/or wait for an input message from the other, when necessary. To see the publications associated with the social and ecological components of this coupled model please see the References section.
Displaying 10 of 129 results for "Emily S Ihara" clear search