Our mission is to help computational modelers develop, document, and share their computational models in accordance with community standards and good open science and software engineering practices. Model authors can publish their model source code in the Computational Model Library with narrative documentation as well as metadata that supports open science and emerging norms that facilitate software citation, computational reproducibility / frictionless reuse, and interoperability. Model authors can also request private peer review of their computational models. Models that pass peer review receive a DOI once published.
All users of models published in the library must cite model authors when they use and benefit from their code.
Please check out our model publishing tutorial and feel free to contact us if you have any questions or concerns about publishing your model(s) in the Computational Model Library.
Displaying 10 of 79 results values clear search
Peer reviewed Casting: A Bio-Inspired Method for Restructuring Machine Learning Ensembles
Colin Lynch Bryan Daniels | Published Thursday, September 18, 2025The wisdom of the crowd refers to the phenomenon in which a group of individuals, each making independent decisions, can collectively arrive at highly accurate solutions—often more accurate than any individual within the group. This principle relies heavily on independence: if individual opinions are unbiased and uncorrelated, their errors tend to cancel out when averaged, reducing overall bias. However, in real-world social networks, individuals are often influenced by their neighbors, introducing correlations between decisions. Such social influence can amplify biases, disrupting the benefits of independent voting. This trade-off between independence and interdependence has striking parallels to ensemble learning methods in machine learning. Bagging (bootstrap aggregating) improves classification performance by combining independently trained weak learners, reducing bias. Boosting, on the other hand, explicitly introduces sequential dependence among learners, where each learner focuses on correcting the errors of its predecessors. This process can reinforce biases present in the data even if it reduces variance. Here, we introduce a new meta-algorithm, casting, which captures this biological and computational trade-off. Casting forms partially connected groups (“castes”) of weak learners that are internally linked through boosting, while the castes themselves remain independent and are aggregated using bagging. This creates a continuum between full independence (i.e., bagging) and full dependence (i.e., boosting). This method allows for the testing of model capabilities across values of the hyperparameter which controls connectedness. We specifically investigate classification tasks, but the method can be used for regression tasks as well. Ultimately, casting can provide insights for how real systems contend with classification problems.
Peer reviewed ABM for Social Cohesion and Wellbeing(ABMSCWB)
Taseer Salahuddin Hasan Vergil | Published Wednesday, June 25, 2025ABM model studying impact of social cohesion on wellbeing of a society. Ibn Khaldun’s cyclical theory of history is being used as the theoretical lens along with some other theories. Social cohesion is measured as TSC = (TVE + 2 * (TPI * TPL - TNI * TNL))/((TPI+TNI))
Where
TSC total-social-cohesion ; Variable for social cohesion
TPI total-positive-interactions ; Count of positive interactions
TNI total-negative-interactions ; Count of negative interactions
TPL total-positive-learning ; Count of positive learning outcomes
…
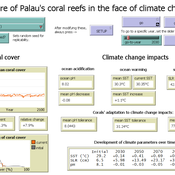
Development of coral reefs under climate change impacts and adaptation options
Nina Preußler | Published Friday, May 30, 2025This NetLogo model simulates how coral reefs around the islands of Palau would develop under different emission scenarios and with selected adaptation strategies. Reef health is indicated by coral cover (%) and is affected by four major climate change impacts: increasing sea surface temperature, sea level rise, ocean acidification, and more intense typhoons. The model differentiates between inner and outer reefs, with the former naturally adapted to warmer, more acidic waters. The simulation includes bleaching events and possible recovery. In addition, the user can choose between different coral transplantation strategies as well as regulate natural thermal adaptation rates.
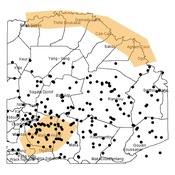
Agent-based modeling of the spatio-temporal distribution of Sahelian transhumant herds
Cheick Amed Diloma Gabriel TRAORE Etienne DELAY Alassane Bah Djibril Diop | Published Tuesday, May 20, 2025Sahelian transhumance is a seasonal pastoral mobility between the transhumant’s terroir of origin and one or more host terroirs. Sahelian transhumance can last several months and extend over hundreds of kilometers. Its purpose is to ensure efficient and inexpensive feeding of the herd’s ruminants. This paper describes an agent-based model to determine the spatio-temporal distribution of Sahelian transhumant herds and their impact on vegetation. Three scenarios based on different values of rainfall and the proportion of vegetation that can be grazed by transhumant herds are simulated. The results of the simulations show that the impact of Sahelian transhumant herds on vegetation is not significant and that rainfall does not impact the alley phase of transhumance. The beginning of the rainy season has a strong temporal impact on the spatial distribution of transhumant herds during the return phase of transhumance.
Agent-based Simulation of Innovation Diffusion
Theresa Elbracht | Published Monday, May 19, 2025The agent-based simulation of innovation diffusion is based on the idea of the Bass model (1969).
The adoption of an agent is driven two parameters: its innovativess p and its prospensity to conform with others. The model is designed for a computational experiment building up on the following four model variations:
(i) the agent population it fully connected and all agents share the same parameter values for p and q
(ii) the agent population it fully connected and agents are heterogeneous, i.e. individual parameter values are drawn from a normal distribution
(iii) the agents population is embeded in a social network and all agents share the same parameter values for p and q
…
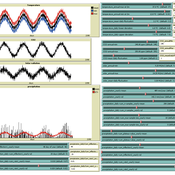
Peer reviewed The Indus Village's Weather model: procedural generation of daily weather
Andreas Angourakis | Published Tuesday, May 13, 2025Overview
The Weather model is a procedural generation model designed to create realistic daily weather data for socioecological simulations. It generates synthetic weather time series for solar radiation, temperature, and precipitation using algorithms based on sinusoidal and double logistic functions. The model incorporates stochastic variation to mimic unpredictable weather patterns and aims to provide realistic yet flexible weather inputs for exploring diverse climate scenarios.
The Weather model can be used independently or integrated into larger models, providing realistic weather patterns without extensive coding or data collection. It can be customized to meet specific requirements, enabling users to gain a better understanding of the underlying mechanisms and have greater confidence in their applications.
…
Social Innovation Model
Jiin Jung | Published Monday, April 28, 2025This research aims to uncover the micro-mechanisms that drive the macro-level relationship between cultural tolerance and innovation. We focus on the indirect influence of minorities—specifically, workers with diverse domain expertise—within collaboration networks. We propose that minority influence from individuals with different expertise can serve as a key driver of organizational innovation, particularly in dynamic market environments, and that cultural tolerance is critical for enabling such minority-induced innovation. Our model demonstrates that seemingly conflicting empirical patterns between cultural tightness/looseness and innovation can emerge from the same underlying micro-mechanisms, depending on parameter values. A systematic simulation experiment revealed an optimal cultural configuration: a medium level of tolerance (t = 0.6) combined with low consistency (κ = 0.05) produced the fastest adaptation to abrupt market changes. These findings provide evidence that indirect minority influence is a core micro-mechanism linking cultural tolerance to innovation.
Peer reviewed AgModel
Isaac Ullah | Published Friday, December 06, 2024AgModel is an agent-based model of the forager-farmer transition. The model consists of a single software agent that, conceptually, can be thought of as a single hunter-gather community (i.e., a co-residential group that shares in subsistence activities and decision making). The agent has several characteristics, including a population of human foragers, intrinsic birth and death rates, an annual total energy need, and an available amount of foraging labor. The model assumes a central-place foraging strategy in a fixed territory for a two-resource economy: cereal grains and prey animals. The territory has a fixed number of patches, and a starting number of prey. While the model is not spatially explicit, it does assume some spatiality of resources by including search times.
Demographic and environmental components of the simulation occur and are updated at an annual temporal resolution, but foraging decisions are “event” based so that many such decisions will be made in each year. Thus, each new year, the foraging agent must undertake a series of optimal foraging decisions based on its current knowledge of the availability of cereals and prey animals. Other resources are not accounted for in the model directly, but can be assumed for by adjusting the total number of required annual energy intake that the foraging agent uses to calculate its cereal and prey animal foraging decisions. The agent proceeds to balance the net benefits of the chance of finding, processing, and consuming a prey animal, versus that of finding a cereal patch, and processing and consuming that cereal. These decisions continue until the annual kcal target is reached (balanced on the current human population). If the agent consumes all available resources in a given year, it may “starve”. Starvation will affect birth and death rates, as will foraging success, and so the population will increase or decrease according to a probabilistic function (perturbed by some stochasticity) and the agent’s foraging success or failure. The agent is also constrained by labor caps, set by the modeler at model initialization. If the agent expends its yearly budget of person-hours for hunting or foraging, then the agent can no longer do those activities that year, and it may starve.
Foragers choose to either expend their annual labor budget either hunting prey animals or harvesting cereal patches. If the agent chooses to harvest prey animals, they will expend energy searching for and processing prey animals. prey animals search times are density dependent, and the number of prey animals per encounter and handling times can be altered in the model parameterization (e.g. to increase the payoff per encounter). Prey animal populations are also subject to intrinsic birth and death rates with the addition of additional deaths caused by human predation. A small amount of prey animals may “migrate” into the territory each year. This prevents prey animals populations from complete decimation, but also may be used to model increased distances of logistic mobility (or, perhaps, even residential mobility within a larger territory).
…
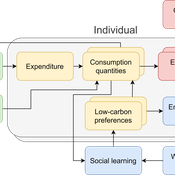
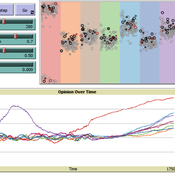
The cultural multiplier of climate policy
Daniel Torren-Peraire | Published Thursday, October 31, 2024For deep decarbonisation, the design of climate policy needs to account for consumption choices being influenced not only by pricing but also by social learning. This involves changes that pertain to the whole spectrum of consumption, possibly involving shifts in lifestyles. In this regard, it is crucial to consider not just short-term social learning processes but also slower, longer-term, cultural change. Against this background, we analyse the interaction between climate policy and cultural change, focusing on carbon taxation. We extend the notion of “social multiplier” of environmental policy derived in an earlier study to the context of multiple consumer needs while allowing for behavioural spillovers between these, giving rise to a “cultural multiplier”. We develop a model to assess how this cultural multiplier contributes to the effectiveness of carbon taxation. Our results show that the cultural multiplier stimulates greater low-carbon consumption compared to fixed preferences. The model results are of particular relevance for policy acceptance due to the cultural multiplier being most effective at low-carbon tax values, relative to a counter-case of short-term social interactions. Notably, at high carbon tax levels, the distinction between social and cultural multiplier effects diminishes, as the strong price signal drives even resistant individuals toward low-carbon consumption. By varying socio-economic conditions, such as substitutability between low- and high-carbon goods, social network structure, proximity of like-minded individuals and the richness of consumption lifestyles, the model provides insight into how cultural change can be leveraged to induce maximum effectiveness of climate policy.
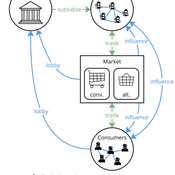
Agent-based model of power dynamics in agri-food systems
Tim Williams | Published Sunday, October 27, 2024 | Last modified Thursday, June 12, 2025This is a stylised agent-based model designed to explore the conditions that lead to lock-ins and transitions in agri-food systems.
The model represents interactions between four different types of agents: farmers, consumers, markets, and the state. Farmers and consumers are heterogeneous, and at each time step decide whether to trade with one of two market agents: the conventional or alternative. The state agent provides subsidies to the farmers at each time step.
The key emergent outcome is the fraction of trade in each time step that flows through the alternative market agent. This arises from the distributed decisions of farmer and consumer agents. A “sustainability transition” is defined as a shift in the dominant practices (and associated balance of power) towards the alternative paradigm.
…
Displaying 10 of 79 results values clear search