Our mission is to help computational modelers develop, document, and share their computational models in accordance with community standards and good open science and software engineering practices. Model authors can publish their model source code in the Computational Model Library with narrative documentation as well as metadata that supports open science and emerging norms that facilitate software citation, computational reproducibility / frictionless reuse, and interoperability. Model authors can also request private peer review of their computational models. Models that pass peer review receive a DOI once published.
All users of models published in the library must cite model authors when they use and benefit from their code.
Please check out our model publishing tutorial and feel free to contact us if you have any questions or concerns about publishing your model(s) in the Computational Model Library.
Displaying 10 of 158 results for "Salvador Martinez-Artero-Martinez" clear search
Multistate modeling extended by behavioral rules
Anna Klabunde Sabine Zinn Frans Willekens Matthias Leuchter | Published Wednesday, August 03, 2016 | Last modified Tuesday, March 13, 2018Toolkit to specify demographic multistate model with a behavioural element linking intentions to behaviour
Managing Connectivity: insights from modelling species interactions accross multiple scales in an idealized landscape
Jacopo A. Baggio Kehinde Salau Michael Schoon Marco Janssen | Published Monday, October 01, 2012 | Last modified Monday, January 20, 2014The model objective’s is to explore the management choice set to uncover which subsets of strategies are most effective at maximizing species coexistence on a fragmented landscape.
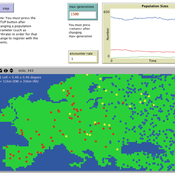
Hominin Ecodynamics v.1.1 (update for perception and interaction)
C Michael Barton | Published Wednesday, August 15, 2012 | Last modified Saturday, April 27, 2013Models land-use, perception, and biocultural interactions between two forager populations.
Last Mile Commuter Behavior Model
Moira Zellner Dean Massey Yoram Shiftan Jonathan Levine Maria Arquero | Published Friday, November 07, 2014 | Last modified Friday, November 07, 2014We represent commuters and their preferences for transportation cost, time and safety. Agents assess their options via their preferences, their environment, and the modes available. The model has policy levers to test impact on last-mile problem.
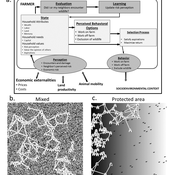
Wildlife-Human Interactions in Shared Landscapes (WHISL)
Andres Baeza-Castro Neil Carter Nicholas Magliocca | Published Friday, May 22, 2020This model simulates a group of farmers that have encounters with individuals of a wildlife population. Each farmer owns a set of cells that represent their farm. Each farmer must decide what cells inside their farm will be used to produce an agricultural good that is self in an external market at a given price. The farmer must decide to protect the farm from potential encounters with individuals of the wildlife population. This decision in the model is called “fencing”. Each time that a cell is fenced, the chances of a wildlife individual to move to that cell is reduced. Each encounter reduces the productive outcome obtained of the affected cell. Farmers, therefore, can reduce the risk of encounters by exclusion. The decision of excluding wildlife is made considering the perception of risk of encounters. In the model, the perception of risk is subjective, as it depends on past encounters and on the perception of risk from other farmers in the community. The community of farmers passes information about this risk perception through a social network. The user (observer) of the model can control the importance of the social network on the individual perception of risk.
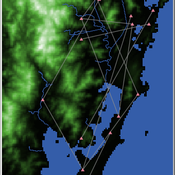
Shellmound Trade
Henrique de Sena Kozlowski | Published Saturday, June 15, 2024This model simulates different trade dynamics in shellmound (sambaqui) builder communities in coastal Southern Brazil. It features two simulation scenarios, one in which every site is the same and another one testing different rates of cooperation. The purpose of the model is to analyze the networks created by the trade dynamics and explore the different ways in which sambaqui communities were articulated in the past.
How it Works?
There are a few rules operating in this model. In either mode of simulation, each tick the agents will produce an amount of resources based on the suitability of the patches inside their occupation-radius, after that the procedures depend on the trade dynamic selected. For BRN? the agents will then repay their owed resources, update their reputation value and then trade again if they need to. For GRN? the agents will just trade with a connected agent if they need to. After that the agents will then consume a random amount of resources that they own and based on that they will grow (split) into a new site or be removed from the simulation. The simulation runs for 1000 ticks. Each patch correspond to a 300x300m square of land in the southern coast of Santa Catarina State in Brazil. Each agent represents a shellmound (sambaqui) builder community. The data for the world were made from a SRTM raster image (1 arc-second) in ArcMap. The sites can be exported into a shapefile (.shp) vector to display in ArcMap. It uses a UTM Sirgas 2000 22S projection system.
Hominin ecodynamics v.2
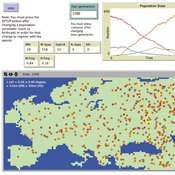
C Michael Barton | Published Monday, September 19, 2011 | Last modified Friday, March 28, 2014Simulates biobehavioral interactions between 2 populations of hominins.
The Effectiveness of Image-Scoring Under Different Ecological Conditions
G M Leighton | Published Monday, January 06, 2014The set of models test how receivers ability to accurately rank signalers under various ecological and behavioral contexts.
PFS - Preference Falsification Simulation (PreFalSim)
Francisco J Miguel Francisco J. León-Medina Jordi Tena-Sanchez | Published Monday, July 01, 2019A model for simulating the evolution of individual’s preferences, incliding adaptive agents “falsifying” -as public opinions- their own preferences. It was builded to describe, explore, experiment and understand how simple heuristics can modulate global opinion dynamics. So far two mechanisms are implemented: a version of Festiguer’s reduction of cognitive disonance, and a version of Goffman’s impression management. In certain social contexts -minority, social rank presure- some models agents can “fake” its public opinion while keeping internally the oposite preference, but after a number of rounds following this falsifying behaviour pattern, a coherence principle can change the real or internal preferences close to that expressed in public.
LogoClim: WorldClim in NetLogo
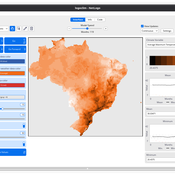
Daniel Vartanian Leandro Garcia Aline Aline Martins de Carvalho | Published Thursday, July 03, 2025 | Last modified Monday, July 13, 2026LogoClim is a NetLogo model designed to be integrated into other simulations through the LevelSpace extension (Hjorth et al., 2020), providing high resolution climate data from sources validated and used by the Intergovernmental Panel on Climate Change (IPCC).
The model simplifies and standardizes the integration of climate data into NetLogo, allowing researchers to focus their efforts on the model itself with the assurance of using reliable and widely recognized data. Although its main use is as a component of larger simulations, LogoClim also has its own graphical interface for monitoring and checking the datasets.
The climate data comes from the WorldClim 2.1 project (Fick & Hijmans, 2017), for which LogoClim works as an interface to NetLogo. The model supports all three WorldClim data series: (1) Historical Climate Data (1970 to 2000), with 12 monthly points for minimum, mean, and maximum temperature, precipitation, solar radiation, wind speed, vapor pressure, elevation, and bioclimatic variables; (2) Historical Monthly Weather Data (1951 to 2024), based on downscaling of CRU-TS-4.09, developed by the Climatic Research Unit at the University of East Anglia (Harris et al., 2020), with minimum and maximum temperature and total precipitation; and (3) Future Climate Data, based on downscaling climate projections derived from global climate models of the Coupled Model Intercomparison Project Phase 6 (CMIP6) (Eyring et al., 2016) for four future periods (2021 to 2040, 2041 to 2060, 2061 to 2080, and 2081 to 2100) and four scenarios based on the Shared Socioeconomic Pathways (SSPs 126, 245, 370, and 585), covering minimum and maximum temperature, total precipitation, and bioclimatic variables. All series are available at multiple spatial resolutions, from 10 minutes (about 340 km² at the equator) to 30 seconds (about 1 km² at the equator).
…
Displaying 10 of 158 results for "Salvador Martinez-Artero-Martinez" clear search