Our mission is to help computational modelers develop, document, and share their computational models in accordance with community standards and good open science and software engineering practices. Model authors can publish their model source code in the Computational Model Library with narrative documentation as well as metadata that supports open science and emerging norms that facilitate software citation, computational reproducibility / frictionless reuse, and interoperability. Model authors can also request private peer review of their computational models. Models that pass peer review receive a DOI once published.
All users of models published in the library must cite model authors when they use and benefit from their code.
Please check out our model publishing tutorial and feel free to contact us if you have any questions or concerns about publishing your model(s) in the Computational Model Library.
Displaying 10 of 376 results for "John C Moore" clear search
Peer reviewed Price Evolution with Expectations
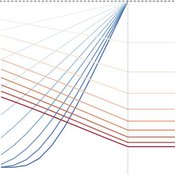
J M Applegate Gesine Steudel Armin Haas Carlo Jaeger | Published Friday, September 10, 2021The Price Evolution with Expectations model provides the opportunity to explore the question of non-equilibrium market dynamics, and how and under which conditions an economic system converges to the classically defined economic equilibrium. To accomplish this, we bring together two points of view of the economy; the classical perspective of general equilibrium theory and an evolutionary perspective, in which the current development of the economic system determines the possibilities for further evolution.
The Price Evolution with Expectations model consists of a representative firm producing no profit but producing a single good, which we call sugar, and a representative household which provides labour to the firm and purchases sugar.The model explores the evolutionary dynamics whereby the firm does not initially know the household demand but eventually this demand and thus the correct price for sugar given the household’s optimal labour.
The model can be run in one of two ways; the first does not include money and the second uses money such that the firm and/or the household have an endowment that can be spent or saved. In either case, the household has preferences for leisure and consumption and a demand function relating sugar and price, and the firm has a production function and learns the household demand over a set number of time steps using either an endogenous or exogenous learning algorithm. The resulting equilibria, or fixed points of the system, may or may not match the classical economic equilibrium.
Anthill: A harvester ant colony built from the published science
Adrian Diez Cuadrado | Published Thursday, September 17, 2026 | Last modified Thursday, September 24, 2026An agent-based model of one colony of the Florida harvester ant, Pogonomyrmex badius, from the day a mated queen lands to the death of the colony. It runs in a web browser and, unchanged, headless in Node for replicate studies.
What the ants do: a claustral queen digs her own shaft and raises the first workers on her reserves; workers dig the nest under local rules, with no ant holding a plan; a one-way, age-based division of labour set by the season of birth, which no shortage reverses; trunk-trail foraging with site fidelity and recruitment; seed storage, opening and germination in the chambers, which is what feeds the larvae; daily weather from the climate normals of the study site, with drought years; nuptial flights after heavy rain; corpse removal; alarm at a disturbance on the foraging ground; and annual nest relocation, in which the store and then the brood are carried along the trail to a new nest the colony digs.
Every value in the model is tagged as measured in this species, borrowed from another ant, or invented, with its source, in a single parameter file. The model is deterministic: one seeded stream per system and a fixed one-minute timestep, so a seed reproduces a run bit for bit in the browser and in Node, which a test pins. A study writes a methods report listing the invented values the results rest on and the acceptance tests the model fails.
…
TechNet_04: Cultural Transmission in a Spatially-Situated Network
Andrew White | Published Monday, October 08, 2012 | Last modified Saturday, April 27, 2013The TechNet_04 is an abstract model that embeds a simple cultural tranmission process in an environment where interaction is structured by spatially-situated networks.
MCA-SdA (ABM of mining-community-aquifer interactions in Salar de Atacama, Chile)
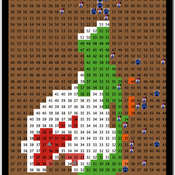
Wenjuan Liu | Published Tuesday, December 01, 2020 | Last modified Thursday, November 04, 2021This model represnts an unique human-aquifer interactions model for the Li-extraction in Salar de Atacama, Chile. It describes the local actors’ experience of mining-induced changes in the socio-ecological system, especially on groundwater changes and social stressors. Social interactions are designed specifically according to a long-term local fieldwork by Babidge et al. (2019, 2020). The groundwater system builds on the FlowLogo model by Castilla-Rho et al. (2015), which was then parameterized and calibrated with local hydrogeological inputs in Salar de Atacama, Chile. The social system of the ABM is defined and customozied based on empirical studies to reflect three major stressors: drought stress, population stress, and mining stress. The model reports evolution of groundwater changes and associated social stress dynamics within the modeled time frame.
Peer reviewed Kenya ITN Agent-Based Microsimulation (2003–2024)
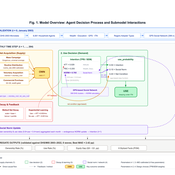
Wooyoung Kim Hosang Shin | Published Saturday, April 18, 2026 | Last modified Tuesday, June 16, 2026An agent-based microsimulation of insecticide-treated net (ITN) distribution and adoption in Kenya (2003–2024), integrating the Theory of Planned Behaviour, Rogers diffusion, Weibull net decay, and a GPS-based two-layer social network. 8,561 household agents calibrated via Approximate Bayesian Computation to six DHS/MIS survey waves, achieving 2.42 pp mean absolute error on Kenya-level ownership. The analysis chain supports mechanism counterfactuals and policy experiments on equity outcomes of ITN distribution strategies.
Peer reviewed Collective Problem-Solving Capacity, Trust, and O-Ring Team Productivity
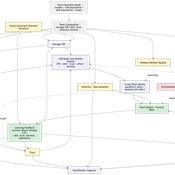
Taseer Salahuddin Hasan Vergil Muhammad Abdullah Yasser | Published Saturday, August 08, 2026This is a NetLogo 7.0.1 agent-based model of interdependent team productivity under O-ring production logic. The model asks when collective problem-solving capacity (CPS) improves team output and when its effect is constrained by trust, burnout, specialization diversity, weak-link quality, and team-formation rules. Agents are heterogeneous in skill, CPS, trust, burnout, effort, learning rate, openness, specialization, adaptability, and aspiration. Each tick forms temporary teams, computes individual contribution quality, combines contributions through a geometric O-ring production function with an explicit weakest-link term, records output and success, and updates agents through feedback, learning, trust change, burnout, recovery, and turnover. The paper follows the ODD protocol, reports exact implementation equations, and analyzes six BehaviorSpace experiments with 50 stochastic repetitions per condition. Scenario results show that CPS is beneficial but not sufficient: productivity is highest when CPS is combined with trust, low burnout, effective coordination, and a reliable weakest-link floor. Diversity yields only modest gains at low CPS but larger gains when CPS is high. Formation-mode results are especially informative because mixed CPS-skill formation maximizes total output, whereas random formation has the highest binary success rate, showing that output magnitude and threshold success can diverge. The study contributes a transparent computational mechanism linking collective intelligence with O-ring production and identifies boundary conditions under which high-CPS teams can still be limited by weak links and interdependence.
Peer reviewed Avian pest control: Yield outcome due to insectivorous birds, falconry, and integration of nest boxes.
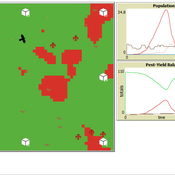
David Jung | Published Monday, November 13, 2023 | Last modified Sunday, November 19, 2023The model aims to simulate predator-prey relationships in an agricultural setting. The focus lies on avian communities and their effect on different pest organisms (here: pest birds, rodents, and arthropod pests). Since most case studies focused on the impact on arthropod pests (AP) alone, this model attempts to include effects on yield outcome. By incorporating three treatments with different factor levels (insectivorous bird species, falconry, nest box density) an experimental setup is given that allows for further statistical analysis to identify an optimal combination of the treatments.
In light of a global decline of birds, insects, and many other groups of organisms, alternative practices of pest management are heavily needed to reduce the input of pesticides. Avian pest control therefore poses an opportunity to bridge the disconnect between humans and nature by realizing ecosystem services and emphasizing sustainable social ecological systems.
Peer reviewed Personnel decisions in the hierarchy
Smarzhevskiy Ivan | Published Friday, August 19, 2022This is a model of organizational behavior in the hierarchy in which personnel decisions are made.
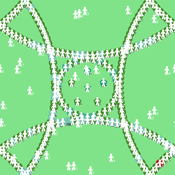
The idea of the model is that the hierarchy, busy with operations, is described by such characteristics as structure (number and interrelation of positions) and material, filling these positions (persons with their individual performance). A particular hierarchy is under certain external pressure (performance level requirement) and is characterized by the internal state of the material (the distribution of the perceptions of others over the ensemble of persons).
The World of the model is a four-level hierarchical structure, consisting of shuff positions of the top manager (zero level of the hierarchy), first-level managers who are subordinate to the top manager, second-level managers (subordinate to the first-level managers) and positions of employees (the third level of the hierarchy). ) subordinated to the second-level managers. Such a hierarchy is a tree, i.e. each position, with the exception of the position of top manager, has a single boss.
Agents in the model are persons occupying the specified positions, the number of persons is set by the slider (HumansQty). Personas have some operational performance (harisma, an unfortunate attribute name left over from the first edition of the model)) and a sense of other personas’ own perceptions. Performance values are distributed over the ensemble of persons according to the normal law with some mean value and variance.
The value of perception by agents of each other is positive or negative (implemented in the model as numerical values equal to +1 and -1). The distribution of perceptions over an ensemble of persons is implemented as a random variable specified by the probability of negative perception, the value of which is set by the control elements of the model interface. The numerical value of the probability equal to 0 corresponds to the case in which all persons positively perceive each other (the numerical value of the random variable is equal to 1, which corresponds to the positive perception of the other person by the individual).
The hierarchy is occupied with operational activity, the degree of intensity of which is set by the external parameter Difficulty. The level of productivity of each manager OAIndex is equal to the level of productivity of the department he leads and is the ratio of the sum of productivity of employees subordinate to the head to the level of complexity of the work Difficulty. An increase in the numerical value of Difficulty leads to a decrease in the OAIndex for all subdivisions of the hierarchy. The managerial meaning of the OAIndex indicator is the percentage of completion of the load specified for the hierarchy as a whole, i.e. the ratio of the actual performance of the structural subdivisions of the hierarchy to the required performance, the level of which is specified by the value of the Difficulty parameter.
…

Artificial Anasazi: Baseline Fixes, Dynamic Soil and Plot Crowding
Thomas Tuoti | Published Sunday, October 04, 2026Artificial Anasazi is an agent-based model of farming households in the Long House Valley, Arizona, from 800 to 1350 CE. Each household chooses where to farm and settle based on expected harvest, water sources and stored maize, and simulated household counts are compared with the archaeological record.
This release adapts the NetLogo Models Library version (Stonedahl & Wilensky 2010) of Janssen’s (2009) NetLogo replication of the original Ascape model (Dean et al. 2000; Axtell et al. 2002). It contains four configurations in one NetLogo 7.0.4 file, selected with two switches:
- Both switches off: the baseline, which is the Models Library model with small fixes that make it work as intended (the arable-uplands zone name, the setup base yield, the initial household count, one-tick-lag capacity reporting, and seed control with observation-only instruments).
soil-on?: dynamic soil quality that depletes under cultivation and regrows, following Janssen (2010, eq. 4).
…
ZIP-Level Housing Supply Elasticity and Crash Dynamics: A GIS-Based Agent-Based Model of the Washington DC and Northern Virginia Metro Region
Mansoor Abdul Bari | Published Saturday, August 01, 2026 | Last modified Sunday, August 02, 2026This model tests whether local housing supply elasticity governs crash severity inside a single metropolitan housing market. Saiz (2010) established that across US metros, regions constrained by geography and regulation experience deeper boom-bust cycles than flexible ones. That finding is routinely applied downward to neighborhoods and ZIP codes as though the mechanism scaled without qualification.
The empirical record for the Washington DC and Northern Virginia region says it does not. Across 84 ZIP codes, measured supply elasticity ranges from 0.35 to 4.95 with a median of 1.21. The worst single-year price decline between 2007 and 2012 averaged 9.6 percent in constrained ZIP codes and 9.0 percent in flexible ones, a gap that cannot be distinguished from noise. Wide variation in the proposed cause, no meaningful separation in the proposed effect.
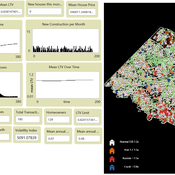
The model embeds households, houses and a metro-wide credit condition in the real ZIP geography of the region using three GIS layers and an empirical price panel. Local elasticity governs construction, exactly as theory predicts. Prices are driven by a shared macro drift schedule and, under the credit-amplified mode, by a leverage cycle with a financial accelerator and a deviation penalty. The design question is whether those shared forces are sufficient to override local supply differences at the sub-metropolitan scale.
…
Displaying 10 of 376 results for "John C Moore" clear search