About the CoMSES Model Library more info
Our mission is to help computational modelers develop, document, and share their computational models in accordance with community standards and good open science and software engineering practices. Model authors can publish their model source code in the Computational Model Library with narrative documentation as well as metadata that supports open science and emerging norms that facilitate software citation, computational reproducibility / frictionless reuse, and interoperability. Model authors can also request private peer review of their computational models. Models that pass peer review receive a DOI once published.
All users of models published in the library must cite model authors when they use and benefit from their code.
Please check out our model publishing tutorial and feel free to contact us if you have any questions or concerns about publishing your model(s) in the Computational Model Library.
We also maintain a curated database of over 7500 publications of agent-based and individual based models with detailed metadata on availability of code and bibliometric information on the landscape of ABM/IBM publications that we welcome you to explore.
Displaying 10 of 941 results for "Chrisja van de Kieft" clear search
Social norms and the dominance of Low-doers
Antonio Franco | Published Wednesday, July 13, 2016 | Last modified Sunday, December 02, 2018The code for the paper “Social norms and the dominance of Low-doers”
Catch Me if You Can: Using a Threshold Model to Simulate Support for Presidential Candidates in the Invisible Primary
Elizabeth Stiles | Published Wednesday, November 14, 2018We use a threshold model to drive our simulated network analysis testing public support for candidates in invisible primaries. We assign voter thresholds for candidates and vary number of voters, attachment to candidates and decay. Results of the algorithm show effects of size of lead, attachment and size of decay.
RBM - A Relation-based model - a fishery implementation
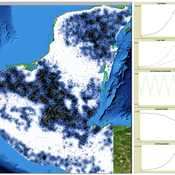
Nanda Wijermans Maja Schlüter Anja Klein Tilman Hertz | Published Monday, March 17, 2025The Relation-Based Model (RBM) purpose is to operationalise (a form of) process-relational (PR) thinking to serve as a thinking tool for process-relational thinking among social-ecological system (SES) researchers. The development of this model itself has been a ‘Proof of concept’- exercise to see whether we actually represent process-relational thinking in a methodology that is entity-based (ABM).
The target of the agent-based model is to show the emergence, change and disappearance of fishing assemblages (focusing on processes of self-organisation) in a Mexican fishery using a process-relational view. From this view, a fishery is regarded as an assemblage in which fishing can be enabled, fishing can occur, and fish can be bought/sold. These core doings - or sub-assemblages or capacities - maintain the assemblage. Each (sub)assemblage reflects different actualisations of constellations of relations and elements (buyers, fishers, fuel, permits, vessels and wind). The RBM thereby reflects an artificial fishery in which agents (elements) and their links (relations) engage in (enabling) fishing and buying/selling.
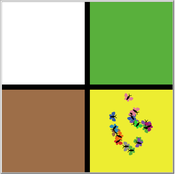
Spatial rangeland model
Marco Janssen | Published Tuesday, January 22, 2019 | Last modified Friday, March 04, 2022Spatial explicit model of a rangeland system, based on Australian conditions, where grass, woody shrubs and fire compete fore resources. Overgrazing can cause the system to flip from a healthy state to an unproductive shrub state. With the model one can explore the consequences of different movement rules of the livestock on the resilience of the system.
The model is discussed in Introduction to Agent-Based Modeling by Marco Janssen. For more information see https://intro2abm.com/.
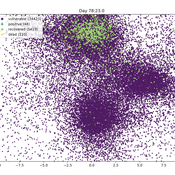
Ornstein-Uhlenbeck Pandemic package
Peter Cotton | Published Friday, April 24, 2020 | Last modified Friday, May 08, 2020Pandemic (pip install pandemic)
An agent model in which commuting, compliance, testing and contagion parameters drive infection in a population of thousands of millions. Agents follow Ornstein-Uhlenbeck processes in the plane and collisions drive transmission. Results are stored at SwarmPrediction.com for further analysis, and can be retrieved by anyone.
This is a very simple simulation that in a special case can be shown to be approximated by a compartmental model with time varying infection rate.
A preliminary extension of the Hemelrijk 1996 model of reciprocal behavior to include feeding
Sean Barton | Published Monday, December 13, 2010 | Last modified Saturday, April 27, 2013A more complete description of the model can be found in Appendix I as an ODD protocol. This model is an expansion of the Hemelrijk (1996) that was expanded to include a simple food seeking behavior.
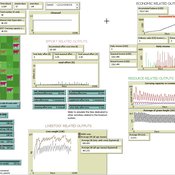
Peer reviewed soslivestock model
Marco Janssen Irene Perez Ibarra Diego J. Soler-Navarro Alicia Tenza Peral | Published Wednesday, May 28, 2025 | Last modified Tuesday, June 10, 2025The purpose of this model is to analyze how different management strategies affect the wellbeing, sustainability and resilience of an extensive livestock system under scenarios of climate change and landscape configurations. For this purpose, it simulates one cattle farming system, in which agents (cattle) move through the space using resources (grass). Three farmer profiles are considered: 1) a subsistence farmer that emphasizes self-sufficiency and low costs with limited attention to herd management practices, 2) a commercial farmer focused on profit maximization through efficient production methods, and 3) an environmental farmer that prioritizes conservation of natural resources and animal welfare over profit maximization. These three farmer profiles share the same management strategies to adapt to climate and resource conditions, but differ in their goals and decision-making criteria for when, how, and whether to implement those strategies. This model is based on the SequiaBasalto model (Dieguez Cameroni et al. 2012, 2014, Bommel et al. 2014 and Morales et al. 2015), replicated in NetLogo by Soler-Navarro et al. (2023).
One year is 368 days. Seasons change every 92 days. Each step begins with the growth of grass as a function of climate and season. This is followed by updating the live weight of animals according to the grass height of their patch, and grass consumption, which is determined based on the updated live weight. Animals can be supplemented by the farmer in case of severe drought. After consumption, cows grow and reproduce, and a new grass height is calculated. This updated grass height value becomes the starting grass height for the next day. Cows then move to the next area with the highest grass height. After that, cattle prices are updated and cattle sales are held on the first day of fall. In the event of a severe drought, special sales are held. Finally, at the end of the day, the farm balance and the farmer’s effort are calculated.
FOUR SEASONS
Lars G Spang | Published Tuesday, March 28, 2017Butterflies (turtles) goes through metamorphism and moves to corresponding patches each season of the year. The number of years and seasons are monitored.
MayaSim: An agent-based model of the ancient Maya social-ecological system
Scott Heckbert | Published Wednesday, July 11, 2012 | Last modified Tuesday, July 02, 2013MayaSim is an agent-based, cellular automata and network model of the ancient Maya. Biophysical and anthropogenic processes interact to grow a complex social ecological system.
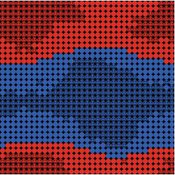
Thoughtless conformity and spread of norms in an artificial society (Grid Model)
Muhammad Azfar Nisar | Published Tuesday, May 27, 2014This model is a small extension (rectangular layout) of Joshua Epstein’s (2001) model on development of thoughtless conformity in an artificial society of agents.
Displaying 10 of 941 results for "Chrisja van de Kieft" clear search