Our mission is to help computational modelers develop, document, and share their computational models in accordance with community standards and good open science and software engineering practices. Model authors can publish their model source code in the Computational Model Library with narrative documentation as well as metadata that supports open science and emerging norms that facilitate software citation, computational reproducibility / frictionless reuse, and interoperability. Model authors can also request private peer review of their computational models. Models that pass peer review receive a DOI once published.
All users of models published in the library must cite model authors when they use and benefit from their code.
Please check out our model publishing tutorial and feel free to contact us if you have any questions or concerns about publishing your model(s) in the Computational Model Library.
Displaying 10 of 192 results reviewed clear search
Peer reviewed Minding Norms in an Epidemic Does Matter
Klaus G. Troitzsch | Published Saturday, February 27, 2021 | Last modified Monday, September 13, 2021This paper tries to shed some light on the mutual influence of citizen behaviour and the spread of a virus in an epidemic. While the spread of a virus from infectious to susceptible persons and the outbreak of an infection leading to more or less severe illness and, finally, to recovery and immunity or death has been modelled with different kinds of models in the past, the influence of certain behaviours to keep the epidemic low and to follow recommendations of others to apply these behaviours has rarely been modelled. The model introduced here uses a theory of the effect of norm invocations among persons to find out the effect of spreading norms interacts with the progress of an epidemic. Results show that norm invocations matter. The model replicates the histories of the COVID-19 epidemic in various region, including “second waves” (but only until the end of 2021 as afterwards the official statistics ceased to be reliable as many infected persons did not report their positive test results after countermeasures were relieved), and shows that the calculation of the reproduction numbers from current reported infections usually overestimates the “real” but in practice unobservable reproduction number.
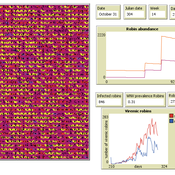
Peer reviewed AMRO_CULEX_WNV
Aniruddha Belsare Jennifer Owen | Published Saturday, February 27, 2021 | Last modified Thursday, March 11, 2021An agent-based model simulating West Nile Virus dynamics in a one host (American robin)-one vector (Culex spp. mosquito) system. ODD improved and code cleaned.
Peer reviewed PolicySpace2: modeling markets and endogenous public policies
Bernardo Furtado | Published Thursday, February 25, 2021 | Last modified Friday, January 14, 2022Policymakers decide on alternative policies facing restricted budgets and uncertain future. Designing public policies is further difficult due to the need to decide on priorities and handle effects across policies. Housing policies, specifically, involve heterogeneous characteristics of properties themselves and the intricacy of housing markets and the spatial context of cities. We propose PolicySpace2 (PS2) as an adapted and extended version of the open source PolicySpace agent-based model. PS2 is a computer simulation that relies on empirically detailed spatial data to model real estate, along with labor, credit, and goods and services markets. Interaction among workers, firms, a bank, households and municipalities follow the literature benchmarks to integrate economic, spatial and transport scholarship. PS2 is applied to a comparison among three competing public policies aimed at reducing inequality and alleviating poverty: (a) house acquisition by the government and distribution to lower income households, (b) rental vouchers, and (c) monetary aid. Within the model context, the monetary aid, that is, smaller amounts of help for a larger number of households, makes the economy perform better in terms of production, consumption, reduction of inequality, and maintenance of financial duties. PS2 as such is also a framework that may be further adapted to a number of related research questions.
Peer reviewed Circular Business Model experimentation: local biodigestion network
Igor Nikolic Kasper Pieter Hendrik Lange Gijsbert Korevaar Paulien Herder | Published Thursday, December 17, 2020 | Last modified Tuesday, June 29, 2021The purpose of the model is to explore the influence of the design of circular business models (CBMs) on CBM viability. The model represents an Industrial Symbiosis Network (ISN) in which a processor uses the organic waste from suppliers to produce biogas and nutrient rich digestate for local reuse. CBM viability is expressed as value captured (e.g., cash flow/tonne waste/agent) and the survival of the network over time (shown in the interface).
In the model, the value captured is calculated relative to the initial state, using incineration costs as a benchmark. Moderating variables are interactions with the waste incinerator and actor behaviour factors. Actors may leave the network when the waste supply for local production is too low, or when personal economic benefits are too low. When the processor decides to leave, the network fails. Theory of planned behaviour can be used to include agent behaviour in the simulations.
Peer reviewed Evolution of Ecological Communities: Testing Constraint Closure
Steve Peck | Published Sunday, December 06, 2020 | Last modified Friday, April 16, 2021Ecosystems are among the most complex structures studied. They comprise elements that seem both stable and contingent. The stability of these systems depends on interactions among their evolutionary history, including the accidents of organisms moving through the landscape and microhabitats of the earth, and the biotic and abiotic conditions in which they occur. When ecosystems are stable, how is that achieved? Here we look at ecosystem stability through a computer simulation model that suggests that it may depend on what constrains the system and how those constraints are structured. Specifically, if the constraints found in an ecological community form a closed loop, that allows particular kinds of feedback may give structure to the ecosystem processes for a period of time. In this simulation model, we look at how evolutionary forces act in such a way these closed constraint loops may form. This may explain some kinds of ecosystem stability. This work will also be valuable to ecological theorists in understanding general ideas of stability in such systems.
Peer reviewed Industrial Symbiosis Network implementation ABM
Igor Nikolic Kasper Pieter Hendrik Lange Gijsbert Korevaar Paulien Herder | Published Tuesday, December 01, 2020 | Last modified Wednesday, June 16, 2021The purpose of the model is to explore the influence of actor behaviour, combined with environment and business model design, on the survival rates of Industrial Symbiosis Networks (ISN), and the cash flows of the agents. We define an ISN to be robust, when it is able to run for 10 years, without falling apart due to leaving agents.
The model simulates the implementation of local waste exchange collaborations for compost production, through the ISN implementation stages of awareness, planning, negotiation, implementation, and evaluation.
One central firm plays the role of waste processor in a local composting initiative. This firm negotiates with other firms to become a supplier of their organic residual streams. The waste suppliers in the model can decide to join the initiative, or to have the waste brought to the external waste incinerator. The focal point of the model are the company-level interactions during the implementation or ending of synergies.
…
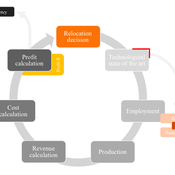
Peer reviewed AUTOMATION-INDUCED RESHORING: An Agent-based Model of the German Manufacturing Industry
Laura Merz | Published Friday, November 20, 2020The agent-based perspective allows insights on how behaviour of firms, guided by simple economic rules on the micro-level, is dynamically influenced by a complex environment in regard to the assumed relocation, decision-making hypotheses. Testing various variables sensitive to initial conditions, increased environmental regulations targeting global trade and upward shifting wage levels in formerly offshore production locations have shown to be driving and inhibiting mechanisms of this socio-technical system. The dynamic demonstrates a shift from predominantly cited economic reasoning for relocation strategies towards sustainability aspects, pressingly changing these realities on an environmental and social dimension. The popular debate is driven by increased environmental awareness and the proclaimed fear of robots killing jobs. In view of reshoring shaping the political agenda, interest in the phenomenon has recently been fuelled by the rise of populism and protectionism.
Peer reviewed An Agent Based Model to assess resilience and efficiency of food supply chains
George Ak Van Voorn Geerten Hengeveld | Published Thursday, November 05, 2020This is an Agent Based Model of a generic food chain network consisting of stylized individuals representing producers, traders, and consumers. It is developed to: 1/ to describe the dynamically changing disaggregated flows of crop items between these agents, and 2/ to be able to explicitly consider agent behavior. The agents have implicit personal objectives for trading. Resilience and efficiency are quantified using the ascendency concept by linking these to the fraction of fulfillment of the overall explicit objective to have all consumers meet their food requirement. Different types of network structures in combination with different agent interaction types under different types of stylized shocks can be simulated.
Peer reviewed An Agent-Based Model of Campaign-Based Watershed Management
Samuel Assefa Aad Kessler Luuk Fleskens | Published Monday, September 21, 2020 | Last modified Friday, June 04, 2021The model simulates the national Campaign-Based Watershed Management program of Ethiopia. It includes three agents (farmers, Kebele/ village administrator, extension workers) and the physical environment that interact with each other. The physical environment is represented by patches (fields). Farmers make decisions on the locations of micro-watersheds to be developed, participation in campaign works to construct soil and water conservation structures, and maintenance of these structures. These decisions affect the physical environment or generate model outcomes. The model is developed to explore conditions that enhance outcomes of the program by analyzing the effect on the area of land covered and quality of soil and water conservation structures of (1) enhancing farmers awareness and motivation, (2) establishing and strengthening micro-watershed associations, (3) introducing alternative livelihood opportunities, and (4) enhancing the commitment of local government actors.
Peer reviewed Gregarious Behavior, Human Colonization and Social Differentiation Agent-Based Model
Gert Jan Hofstede Mark R Kramer Sebastian Fajardo Andrés Bernal Martijn de Vries | Published Thursday, August 20, 2020 | Last modified Thursday, October 29, 2020Studies of colonization processes in past human societies often use a standard population model in which population is represented as a single quantity. Real populations in these processes, however, are structured with internal classes or stages, and classes are sometimes created based on social differentiation. In this present work, information about the colonization of old Providence Island was used to create an agent-based model of the colonization process in a heterogeneous environment for a population with social differentiation. Agents were socially divided into two classes and modeled with dissimilar spatial clustering preferences. The model and simulations assessed the importance of gregarious behavior for colonization processes conducted in heterogeneous environments by socially-differentiated populations. Results suggest that in these conditions, the colonization process starts with an agent cluster in the largest and most suitable area. The spatial distribution of agents maintained a tendency toward randomness as simulation time increased, even when gregariousness values increased. The most conspicuous effects in agent clustering were produced by the initial conditions and behavioral adaptations that increased the agent capacity to access more resources and the likelihood of gregariousness. The approach presented here could be used to analyze past human colonization events or support long-term conceptual design of future human colonization processes with small social formations into unfamiliar and uninhabited environments.
Displaying 10 of 192 results reviewed clear search