Our mission is to help computational modelers develop, document, and share their computational models in accordance with community standards and good open science and software engineering practices. Model authors can publish their model source code in the Computational Model Library with narrative documentation as well as metadata that supports open science and emerging norms that facilitate software citation, computational reproducibility / frictionless reuse, and interoperability. Model authors can also request private peer review of their computational models. Models that pass peer review receive a DOI once published.
All users of models published in the library must cite model authors when they use and benefit from their code.
Please check out our model publishing tutorial and feel free to contact us if you have any questions or concerns about publishing your model(s) in the Computational Model Library.
Displaying 10 of 118 results for "Michael Barton" clear search
Foragers to Farmers
Nick Gauthier Elske van der Vaart Michael Storozum Tim Dorscheidt | Published Monday, July 22, 2024This model is represents an effort to replicate one of the first attempts (van der Vaart 2006) to develop an agent based model of agricultural origins using principles and equations drawn from human behavioral ecology. We have taken one theory of habitat choice (Ideal Free Distribution) and applied it to human behavioral adaptations to differences in resource quality of different habitats.
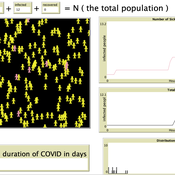
Introductory SIR Model
Kit Martin Amber Cesare Matthew Johnson | Published Tuesday, September 28, 2021This is a basic Susceptible, Infected, Recovered (SIR) model. This model explores the spread of disease in a space. In particular, it explores how changing assumptions about the number of susceptible people, starting number of infected people, as well as the disease’s infection probability, and average duration of infection. The model shows that the interactions of agents can drastically affect the results of the model.
We used it in our course on COVID-19: https://www.csats.psu.edu/science-of-covid19
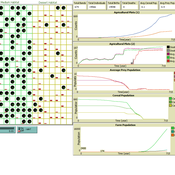
COVID-19 SIR with Public Health Interventions
Kit Martin Amber Cesare Matthew Johnson | Published Tuesday, September 28, 2021This is an extension of the basic Suceptible, Infected, Recovered (SIR) model. This model explores the spread of disease in two spaces, one a treatment, and one a control. Through the modeling options, one can explore how changing assumptions about the number of susceptible people, starting number of infected people, the disease’s infection probability, and average duration impacts the outcome. In addition, this version allows users to explore how public health interventions like social distancing, masking, and isolation can affect the number of people infected. The model shows that the interactions of agents, and the interventions can drastically affect the results of the model.
We used the model in our course about COVID-19: https://www.csats.psu.edu/science-of-covid19
An agent-based simulation of discussion processes in risk workshops
Matthias Meyer Clemens Harten Lucia Bellora-Bienengräber | Published Thursday, September 30, 2021The model measures drivers of effectiveness of risk assessments in risk workshops regarding the correctness and required time. Specifically, we model the limits to information transfer, incomplete discussions, group characteristics, and interaction patterns and investigate their effect on risk assessment in risk workshops.
The model simulates a discussion in the context of a risk workshop with 9 participants. The participants use Bayesian networks to assess a given risk individually and as a group.
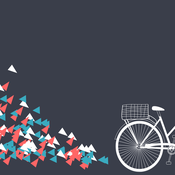
Bicycle model
Gudrun Wallentin Dana Kaziyeva Martin Loidl | Published Thursday, January 10, 2019 | Last modified Monday, February 22, 2021The purpose of the model is to generate the spatio-temporal distribution of bicycle traffic flows at a regional scale level. Disaggregated results are computed for each network segment with the minute time step. The human decision-making is governed by probabilistic rules derived from the mobility survey.
City Sandbox
Javier Sandoval | Published Thursday, January 09, 2020This model grows land use patterns that emerge as a result of land-use compatibilities stablished in urban development plans, land topography, and street networks. It contains urban brushes to paint streets and land uses as a way to learn about urban pattern emergence through free experimentation.
Agent-based Model of Industrial Evolution
Martin Zoričak Denis Horvath Vladimir Gazda Oto Hudec | Published Wednesday, July 10, 2019This is a conceptual model of underlying forces creating industrial clusters. There are two contradictory forces - attraction and repulsion. Firms within the same Industry are attracted to each other and on the other hand, firms with the same Activity are repulsed from each other. In each round firm with the lowest fitness is selected to change its profile of Industries and Activities. Based on these simple rules interesting patterns emerge.
Threshold Public Goods Game Models with Punishment
Martin Zoričak Vladimir Gazda Gabriela Koľveková Manuela Raisová | Published Saturday, June 06, 2020This is a set of threshold public goods games models. Set consists of baseline model, endogenous shared punishment model, endogenous shared punishment model with activists and cooperation model. In each round, all agents are granted a budget of size set in GUI. Then they decide on how much they contribute to public goods and how much they keep. Public goods are provided only if the sum of contributions meets or exceeds the threshold defined in the GUI. After each round agents evaluate their strategy and payoff from this strategy.
Pedestrian model
Gudrun Wallentin Dana Kaziyeva Martin Loidl Petra Stutz | Published Monday, August 07, 2023The model generates disaggregated traffic flows of pedestrians, simulating their daily mobility behaviour represented as probabilistic rules. Various parameters of physical infrastructure and travel behaviour can be altered and tested. This allows predicting potential shifts in traffic dynamics in a simulated setting. Moreover, assumptions in decision-making processes are general for mid-sized cities and can be applied to similar areas.
Together with the model files, there is the ODD protocol with the detailed description of model’s structure. Check the associated publication for results and evaluation of the model.
Installation
Download GAMA-platform (GAMA1.8.2 with JDK version) from https://gama-platform.github.io/. The platform requires a minimum of 4 GB of RAM.
…
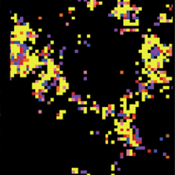
Animal territory formation (Reusable Building Block RBB)
Volker Grimm Stephanie Kramer-Schadt Robert Zakrzewski | Published Sunday, November 12, 2023This is a generic sub-model of animal territory formation. It is meant to be a reusable building block, but not in the plug-and-play sense, as amendments are likely to be needed depending on the species and region. The sub-model comprises a grid of cells, reprenting the landscape. Each cell has a “quality” value, which quantifies the amount of resources provided for a territory owner, for example a tiger. “Quality” could be prey density, shelter, or just space. Animals are located randomly in the landscape and add grid cells to their intial cell until the sum of the quality of all their cells meets their needs. If a potential new cell to be added is owned by another animal, competition takes place. The quality values are static, and the model does not include demography, i.e. mortality, mating, reproduction. Also, movement within a territory is not represented.
Displaying 10 of 118 results for "Michael Barton" clear search