About the CoMSES Model Library more info
Our mission is to help computational modelers at all levels engage in the establishment and adoption of community standards and good practices for developing and sharing computational models. Model authors can freely publish their model source code in the Computational Model Library alongside narrative documentation, open science metadata, and other emerging open science norms that facilitate software citation, reproducibility, interoperability, and reuse. Model authors can also request peer review of their computational models to receive a DOI.
All users of models published in the library must cite model authors when they use and benefit from their code.
Please check out our model publishing tutorial and contact us if you have any questions or concerns about publishing your model(s) in the Computational Model Library.
We also maintain a curated database of over 7500 publications of agent-based and individual based models with additional detailed metadata on availability of code and bibliometric information on the landscape of ABM/IBM publications that we welcome you to explore.
Displaying 10 of 105 results for "Steven Dalderop" clear search
Linear recruitment leads to allocation and flexibility in collective foraging by ants
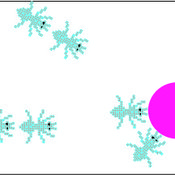
Takao Sasaki Zachary Joseph Shaffer Stephen Pratt | Published Thursday, July 11, 2013 | Last modified Thursday, September 05, 2013Ants in the genus Temnothorax use tandem runs (rather than pheromone trails) to recruit to food sources. This model explores the collective consequences of this linear recruitment (as opposed to highly nonlinear pheromone trails).
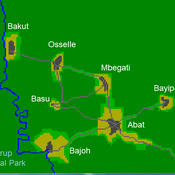
A stylized scale model to codesign with villagers an agent-based model of bushmeat hunting in the periphery of Korup National Park (Cameroon)
BarterNet is a platform for modeling early barter networks with the aim of learning how supply and demand for a good determine if traders will learn to use that good as a form of money. Traders use a good as money when they offer to trade for it even if they can’t consume it, but believe that they can subsequently trade it for a good they can consume in the near future.
Peer reviewed Torsten Hägerstrand’s Spatial Innovation Diffusion Model
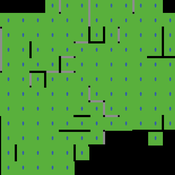
Sean Bergin | Published Friday, September 14, 2012 | Last modified Saturday, April 27, 2013This model is a replication of Torsten Hägerstrand’s 1965 model–one of the earliest known calibrated and validated simulations with implicit “agent based” methodology.

REHAB: A Role Playing Game to Explore the Influence of Knowledge and Communication on Natural Resources Management
Christophe Le Page Anne Dray Pascal Perez Claude Garcia | Published Monday, July 13, 2015 | Last modified Monday, July 13, 2015REHAB has been designed as an ice-breaker in courses dealing with ecosystem management and participatory modelling. It helps introducing the two main tools used by the Companion Modelling approach, namely role-playing games and agent-based models.
Household Energy Retrofit Behavior (HERB) ABM
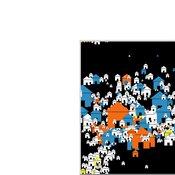
Lars Even Egner | Published Thursday, October 20, 2022The HERB model simulates the retrofit behavior of homeowners in a neighborhood. The model initially parameterizes a neighborhood and households with technical factors such as energy standard, the availability of subsidies, and neighbors’ retrofit activity. Then, these factors are translated into psychological variables such as perceived comfort gain, worry about affording the retrofit, and perceiving the current energy standard of the home as wasteful. These psychological variables moderate the transition between four different stages of deciding to retrofit, as suggested by a behavioral model specific to household energy retrofitting identified based on a large population survey in Norway. The transition between all stages eventually leads to retrofitting, which affects both the household’s technical factors and friends and neighbors, bringing the model “full circle”. The model assumes that the energy standard of the buildings deteriorates over time, forcing households to retrofit regularly to maintain a certain energy standard.
Because experiment datafiles are about 15GB, they are available at https://doi.org/10.18710/XOSAMD
Citation Agents: A model of collective learning through scientific publication
Christopher Watts | Published Friday, July 31, 2015Simulates the construction of scientific journal publications, including authors, references, contents and peer review. Also simulates collective learning on a fitness landscape. Described in: Watts, Christopher & Nigel Gilbert (forthcoming) “Does cumulative advantage affect collective learning in science? An agent-based simulation”, Scientometrics.
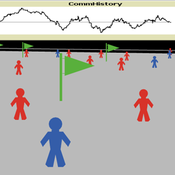
Model of communication between two groups of managers in the course of project implementation
Smarzhevskiy Ivan | Published Monday, December 07, 2020This is a simulation model of communication between two groups of managers in the course of project implementation. The “world” of the model is a space of interaction between project participants, each of which belongs either to a group of work performers or to a group of customers. Information about the progress of the project is publicly available and represents the deviation Earned value (EV) from the planned project value (cost baseline).
The key elements of the model are 1) persons belonging to a group of customers or performers, 2) agents that are communication acts. The life cycle of persons is equal to the time of the simulation experiment, the life cycle of the communication act is 3 periods of model time (for the convenience of visualizing behavior during the experiment). The communication act occurs at a specific point in the model space, the coordinates of which are realized as random variables. During the experiment, persons randomly move in the model space. The communication act involves persons belonging to a group of customers and a group of performers, remote from the place of the communication act at a distance not exceeding the value of the communication radius (MaxCommRadius), while at least one representative from each of the groups must participate in the communication act. If none are found, the communication act is not carried out. The number of potential communication acts per unit of model time is a parameter of the model (CommPerTick).
The managerial sense of the feedback is the stimulating effect of the positive value of the accumulated communication complexity (positive background of the project implementation) on the productivity of the performers. Provided there is favorable communication (“trust”, “mutual understanding”) between the customer and the contractor, it is more likely that project operations will be performed with less lag behind the plan or ahead of it.
The behavior of agents in the world of the model (change of coordinates, visualization of agents’ belonging to a specific communicative act at a given time, etc.) is not informative. Content data are obtained in the form of time series of accumulated communicative complexity, the deviation of the earned value from the planned value, average indicators characterizing communication - the total number of communicative acts and the average number of their participants, etc. These data are displayed on graphs during the simulation experiment.
The control elements of the model allow seven independent values to be varied, which, even with a minimum number of varied values (three: minimum, maximum, optimum), gives 3^7 = 2187 different variants of initial conditions. In this case, the statistical processing of the results requires repeated calculation of the model indicators for each grid node. Thus, the set of varied parameters and the range of their variation is determined by the logic of a particular study and represents a significant narrowing of the full set of initial conditions for which the model allows simulation experiments.
…
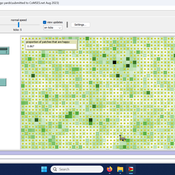
Peer reviewed Yards
srailsback Emily Minor Soraida Garcia Philip Johnson | Published Thursday, November 02, 2023This is a model of plant communities in urban and suburban residential neighborhoods. These plant communities are of interest because they provide many benefits to human residents and also provide habitat for wildlife such as birds and pollinators. The model was designed to explore the social factors that create spatial patterns in biodiversity in yards and gardens. In particular, the model was originally developed to determine whether mimicry behaviors–-or neighbors copying each other’s yard design–-could produce observed spatial patterns in vegetation. Plant nurseries and socio-economic constraints were also added to the model as other potential sources of spatial patterns in plant communities.
The idea for the model was inspired by empirical patterns of spatial autocorrelation that have been observed in yard vegetation in Chicago, Illinois (USA), and other cities, where yards that are closer together are more similar than yards that are farther apart. The idea is further supported by literature that shows that people want their yards to fit into their neighborhood. Currently, the yard attribute of interest is the number of plant species, or species richness. Residents compare the richness of their yards to the richness of their neighbors’ yards. If a resident’s yard is too different from their neighbors, the resident will be unhappy and change their yard to make it more similar.
The model outputs information about the diversity and identity of plant species in each yard. This can be analyzed to look for spatial autocorrelation patterns in yard diversity and to explore relationships between mimicry behaviors, yard diversity, and larger scale diversity.
The effect of error on cultural transmission
Claudine Gravel-Miguel | Published Thursday, November 01, 2012 | Last modified Saturday, April 27, 2013This is the replication of the experiment performed by Eerkens and Lipo (2005) to look at the effect of copying errors when specific traits are transferred from an individual to another.
Displaying 10 of 105 results for "Steven Dalderop" clear search