Our mission is to help computational modelers develop, document, and share their computational models in accordance with community standards and good open science and software engineering practices. Model authors can publish their model source code in the Computational Model Library with narrative documentation as well as metadata that supports open science and emerging norms that facilitate software citation, computational reproducibility / frictionless reuse, and interoperability. Model authors can also request private peer review of their computational models. Models that pass peer review receive a DOI once published.
All users of models published in the library must cite model authors when they use and benefit from their code.
Please check out our model publishing tutorial and feel free to contact us if you have any questions or concerns about publishing your model(s) in the Computational Model Library.
Displaying 10 of 47 results replication clear search
Fragile, Resilient, Asymmetric: An Agent-Based Stress Test of European Cooperation under Geopolitical Shocks (2024–2040)
Alessandro Brugnoletti | Published Tuesday, August 25, 2026Agent-based model of cooperation among fourteen EU member states under geopolitical shocks, 2024-2040. States are adaptive agents on the observed intra-EU trade network, updating a cooperation propensity through inertia, network influence, and a repeated-game payoff structure built from verified Eurostat, Eurobarometer and IMF data. An anchoring device makes the observed 2024 configuration exactly stationary absent shocks, so results are read as deviations from an empirical baseline. Five scenarios of increasing severity are simulated with Monte Carlo replication, up to an extreme counterfactual crisis in the Taiwan Strait. Includes six robustness batteries and a full ODD description.
Observer Zero: an instrumented artificial world for studying scientific belief revision in autonomous LLM agents
Nick Lamb | Published Thursday, August 13, 2026Meridian is a deterministic artificial world in which autonomous LLM scientist agents run
experiments on instruments, exchange letters, and maintain explicit probabilistic beliefs, while
a physical constant changes covertly mid-run. The true state is known only to the simulator, so
whether anyone notices becomes a measurement rather than an interpretation.
The platform separates three things that are usually confounded: what could have been known from
…
Peer reviewed Collective Problem-Solving Capacity, Trust, and O-Ring Team Productivity
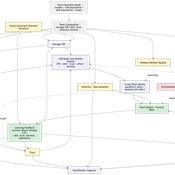
Taseer Salahuddin Hasan Vergil Muhammad Abdullah Yasser | Published Saturday, August 08, 2026This is a NetLogo 7.0.1 agent-based model of interdependent team productivity under O-ring production logic. The model asks when collective problem-solving capacity (CPS) improves team output and when its effect is constrained by trust, burnout, specialization diversity, weak-link quality, and team-formation rules. Agents are heterogeneous in skill, CPS, trust, burnout, effort, learning rate, openness, specialization, adaptability, and aspiration. Each tick forms temporary teams, computes individual contribution quality, combines contributions through a geometric O-ring production function with an explicit weakest-link term, records output and success, and updates agents through feedback, learning, trust change, burnout, recovery, and turnover. The paper follows the ODD protocol, reports exact implementation equations, and analyzes six BehaviorSpace experiments with 50 stochastic repetitions per condition. Scenario results show that CPS is beneficial but not sufficient: productivity is highest when CPS is combined with trust, low burnout, effective coordination, and a reliable weakest-link floor. Diversity yields only modest gains at low CPS but larger gains when CPS is high. Formation-mode results are especially informative because mixed CPS-skill formation maximizes total output, whereas random formation has the highest binary success rate, showing that output magnitude and threshold success can diverge. The study contributes a transparent computational mechanism linking collective intelligence with O-ring production and identifies boundary conditions under which high-CPS teams can still be limited by weak links and interdependence.
ZIP-Level Housing Supply Elasticity and Crash Dynamics: A GIS-Based Agent-Based Model of the Washington DC and Northern Virginia Metro Region
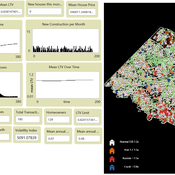
Mansoor Abdul Bari | Published Saturday, August 01, 2026 | Last modified Sunday, August 02, 2026This model tests whether local housing supply elasticity governs crash severity inside a single metropolitan housing market. Saiz (2010) established that across US metros, regions constrained by geography and regulation experience deeper boom-bust cycles than flexible ones. That finding is routinely applied downward to neighborhoods and ZIP codes as though the mechanism scaled without qualification.
The empirical record for the Washington DC and Northern Virginia region says it does not. Across 84 ZIP codes, measured supply elasticity ranges from 0.35 to 4.95 with a median of 1.21. The worst single-year price decline between 2007 and 2012 averaged 9.6 percent in constrained ZIP codes and 9.0 percent in flexible ones, a gap that cannot be distinguished from noise. Wide variation in the proposed cause, no meaningful separation in the proposed effect.
The model embeds households, houses and a metro-wide credit condition in the real ZIP geography of the region using three GIS layers and an empirical price panel. Local elasticity governs construction, exactly as theory predicts. Prices are driven by a shared macro drift schedule and, under the credit-amplified mode, by a leverage cycle with a financial accelerator and a deviation penalty. The design question is whether those shared forces are sufficient to override local supply differences at the sub-metropolitan scale.
…
Peer reviewed MOSAIC: Mission-Oriented Self-Organization through Auctions, Incentives, and Coalitions
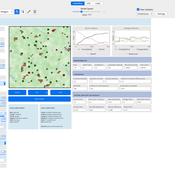
Katherin Molina Lorena Holguin | Published Friday, July 31, 2026 | Last modified Thursday, August 20, 2026MOSAIC is an agent-based NetLogo model of decentralized mission coordination among heterogeneous robots operating under partial observability, limited energy, spatially variable risk, dynamic communication, and individual and cooperative task requirements. Robots discover tasks locally, exchange task information through temporary communication links, submit capability-, energy-, deadline-, and risk-aware bids, compete for individual contracts, and form temporary coalitions for cooperative tasks.
The model integrates decentralized auctions, greedy capability-based coalition formation, contract release and reassignment, four reward regimes, reputation, adaptive bidding strategies, failure traceability, and mission-, network-, information-, inequality-, and coalition-level metrics. It operates without a centralized mission planner or global combinatorial assignment solver.
Seven paired-seed BehaviorSpace experiments comprising 690 official simulation runs evaluate baseline mission viability, reward regimes, communication structure, capability heterogeneity, cooperative-task demand, reputation and adaptive strategies, and mission-incentive strength. The results indicate that structural coordination capacity—particularly information reach, capability compatibility, and feasible coalition construction—has a stronger effect on mission completion than increasing incentive intensity within the tested architecture and parameter ranges.
…
An Agent-Based Model of Saving under Quasi-Hyperbolic Discounting on a Social Network.
Jose Alejandro Velazquez Monzon | Published Wednesday, June 24, 2026An agent-based model of saving and dissaving behaviour under quasi-hyperbolic (β–δ) discounting. Building on the individual decision problem of Cao and Werning (2018), the model embeds present-biased agents in a Watts–Strogatz small-world network and adds three configurable mechanisms of social influence — information diffusion, peer comparison, and social-norm conformity — across five heterogeneous behavioural profiles (Planners, Moderates, Procrastinators, Inverse Procrastinators, and Impulsive agents).
Each profile’s saving policy is approximated by value-function iteration over a discretised wealth grid; the solved policies are cached and applied as agents interact over their network neighbourhoods. The model tests whether each social mechanism can alter the saving and wealth trajectories that present-biased agents would otherwise follow in isolation, and characterises the direction and size of each effect on median wealth, wealth inequality (Gini), and the incidence of severely depleted agents.
The deposit includes the core model (Model.py), an analysis and visualisation pipeline (analyze_results.py), a standalone ODD description (ODD.md), and pinned dependencies.
Zensei Wago: A Wealth-Integrated Social Capital Model
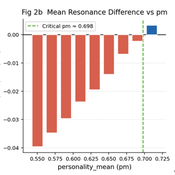
hiiki | Published Friday, May 15, 2026Interest-based compound economies generate monotonically increasing wealth inequality through multiplicative accumulation dynamics, yet the conditions under which gift-based reciprocal exchange outperforms such systems in collective well-being remain unquantified. We present Zensei Wago (全生和合), a seven-layer agent-based model comparing a Gift Resource Circulation (GRC) economy with a Compound Interest Circulation (CIC) economy under identical initial conditions. Across N = 5000 Monte Carlo replications (T = 700 ticks, N = 100 agents), GRC produced significantly higher collective resonance than CIC (p < 0.001, Cohen’s d = +0.171), above a critical prosocial threshold pm ≈ 0.698. Cohen’s d grows monotonically with duration — d = +1.943 at T = 1500 and d = +4.126 at T = 3000 — driven primarily by structural collapse of CIC resonance as inequality exceeds a critical Gini threshold (G > 0.333), while GRC resonance remains stable. The gift mechanism further decouples collective well-being from distributional outcomes, generating resonance through relational quality rather than material redistribution. Network topology analysis across seven configurations — combining a Watts-Strogatz rewiring sweep and a T = 1500 longitudinal replication — reveals that ring topology maximises GRC advantage (d = +1.17), that most topology-dependent reversals are transient (sparse and small-world both transition to significantly positive by T = 1500), and that a critical rewiring threshold of p ≈ 0.10–0.20 separates GRC-advantaged from GRC-disadvantaged network configurations. Scale-free networks remain persistently adverse (d = -7.24*), requiring structural redesign for gift-economy viability.
The Informational Assumptions of Schelling Segregation: An Agent-Based Decomposition of Cue Inference, Cultural Schemas, and Residential Sorting
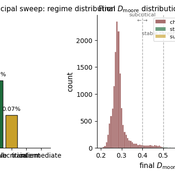
Eric Gladstone | Published Wednesday, May 13, 2026This computational model accompanies the article “The Informational Assumptions of Schelling Segregation: An Agent-Based Decomposition of Cue Inference, Cultural Schemas, and Residential Sorting.” It implements an agent-based model in which agents infer latent neighborhood-type classes from noisy non-demographic cues through schema-specific diagnostic mappings, update beliefs, and relocate when satisfaction on a preferred latent class falls below a threshold.
The model serves as a mechanism-isolation device for studying the informational architecture underlying Schelling-style residential sorting. It includes the principal sweep configuration (14,400 runs across a seven-parameter grid), a disagreement-metric sub-sweep with permutation-minimized Jensen-Shannon divergence recorded natively, controls (positive, negative, and frozen-belief), a paired-seed cue-channel perturbation experiment, and selected-cell sensitivity sweeps for cue persistence and home-biased mobility.
The full ODD protocol, parameter manifests, deterministic seed schedules, processed outputs, regenerable figure scripts, the verification test suite, and the satisfaction-mapping audit document are included. Every reported run is deterministic given a (config, seed) pair, and an included audit script verifies bit-for-bit replay on sampled runs.
Peer reviewed Kenya ITN Agent-Based Microsimulation (2003–2024)
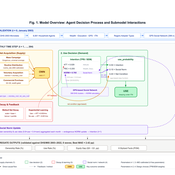
Wooyoung Kim Hosang Shin | Published Saturday, April 18, 2026 | Last modified Tuesday, June 16, 2026An agent-based microsimulation of insecticide-treated net (ITN) distribution and adoption in Kenya (2003–2024), integrating the Theory of Planned Behaviour, Rogers diffusion, Weibull net decay, and a GPS-based two-layer social network. 8,561 household agents calibrated via Approximate Bayesian Computation to six DHS/MIS survey waves, achieving 2.42 pp mean absolute error on Kenya-level ownership. The analysis chain supports mechanism counterfactuals and policy experiments on equity outcomes of ITN distribution strategies.
Simulating Climate Stress and Social Instability: An Agent-Based Model of Ecosystem Degradation and Violence in Coastal Communities
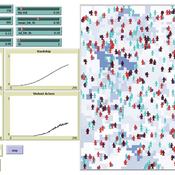
Jacopo A. Baggio hurtado-valdivieso | Published Sunday, April 12, 2026This model is an agent-based simulation designed to explore how climate-induced environmental degradation can contribute to the emergence of social violence in coastal communities that depend heavily on ecosystem services for their livelihoods. The model represents a coupled social–ecological system in which environmental shocks—such as sea level rise and marine ecosystem decline—affect local economic conditions, food security, and community stability.
Agents in the model represent individuals whose livelihoods depend on coastal ecosystems. Environmental degradation reduces ecosystem productivity and increases economic hardship, which can lead to the formation of grievances among agents. The model incorporates behavioral thresholds that determine how individuals respond to hardship and perceived injustice. Under certain conditions—particularly when institutional capacity and law enforcement effectiveness are limited—these grievances may escalate into violent behavior.
The simulation allows users to explore how different climate scenarios, levels of ecosystem degradation, livelihood dependence, and institutional responses influence the probability of social instability and violence. By modeling the interactions between environmental stress, socio-economic vulnerability, and governance capacity, the model provides a computational framework for examining potential pathways linking climate change and conflict in coastal social–ecological systems.
…
Displaying 10 of 47 results replication clear search