About the CoMSES Model Library more info
Our mission is to help computational modelers develop, document, and share their computational models in accordance with community standards and good open science and software engineering practices. Model authors can publish their model source code in the Computational Model Library with narrative documentation as well as metadata that supports open science and emerging norms that facilitate software citation, computational reproducibility / frictionless reuse, and interoperability. Model authors can also request private peer review of their computational models. Models that pass peer review receive a DOI once published.
All users of models published in the library must cite model authors when they use and benefit from their code.
Please check out our model publishing tutorial and feel free to contact us if you have any questions or concerns about publishing your model(s) in the Computational Model Library.
We also maintain a curated database of over 7500 publications of agent-based and individual based models with detailed metadata on availability of code and bibliometric information on the landscape of ABM/IBM publications that we welcome you to explore.
Displaying 10 of 439 results for "Therese Lindahl" clear search
SMILI: Small-scale fisheries Institutions and Local Interactions
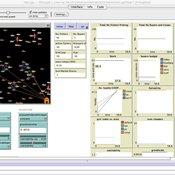
Emilie Lindkvist Maja Schlüter Xavier Basurto | Published Thursday, March 09, 2017The model represents an archetypical fishery in a co-evolutionary social-ecological environment, capturing different dimensions of trust between fishers and fish buyers for the establishment and persistence of self-governance arrangements.
01b ModEco NLG V1.39 – Model Economies – The PMM
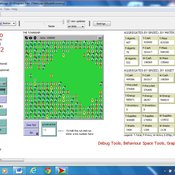
Garvin Boyle | Published Friday, April 14, 2017It is very difficult to model a sustainable intergenerational biophysical/financial economy. ModEco NLG is one of a series of models exploring the dynamics of sustainable economics – PSoup, ModEco, EiLab, OamLab, MppLab, TpLab, CmLab.
04 TpLab V2.08 – Teleological Pruning Laboratory
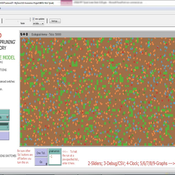
Garvin Boyle | Published Saturday, April 15, 2017Our societal belief systems are pruned by evolution, informing our unsustainable economies. This is one of a series of models exploring the dynamics of sustainable economics – PSoup, ModEco, EiLab, OamLab, MppLab, TpLab, CmLab.
Viticulture development in emerging markets: Małopolska region
Marcin Czupryna Bogumił Kamiński Paweł Oleksy Piotr Przybek | Published Tuesday, November 28, 2017 | Last modified Saturday, June 16, 2018Model explains both the final state and the dynamics of the development process of the wine sector in the Małopolska region in Poland. Model admits heterogeneous agents (regular farms,large and small vineyards).
An Agent-Based Simulation of Continuous-Time Public Goods Games
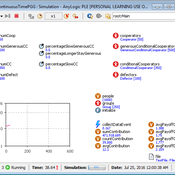
Tuong Manh Vu | Published Thursday, May 17, 2018 | Last modified Tuesday, April 02, 2019To our knowledge, this is the first agent-based simulation of continuous-time PGGs (where participants can change contributions at any time) which are much harder to realise within both laboratory and simulation environments.
Work related to this simulation has been published in the following journal article:
Vu, Tuong Manh, Wagner, Christian and Siebers, Peer-Olaf (2019) ‘ABOOMS: Overcoming the Hurdles of Continuous-Time Public Goods Games with a Simulation-Based Approach’ Journal of Artificial Societies and Social Simulation 22 (2) 7 http://jasss.soc.surrey.ac.uk/22/2/7.html. doi: 10.18564/jasss.3995
Abstract:
…
MEGADAPT - Socio-hydrological risk model - Theoretical (no data) implementation
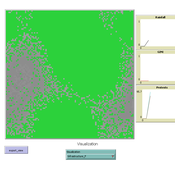
Marco Janssen Andres Baeza-Castro Luis Bojorquez Hallie Eakin | Published Wednesday, February 06, 2019The model simulates the decisions of residents and a water authority to respond to socio-hydrological hazards. Residents from neighborhoods are located in a landscape with topographic complexity and two problems: water scarcity in the peripheral neighborhoods at high altitude and high risk of flooding in the lowlands, at the core of the city. The role of the water authority is to decide where investments in infrastructure should be allocated to reduce the risk to water scarcity and flooding events in the city, and these decisions are made via a multi-objective site selection procedure. This procedure accounts for the interdependencies and feedback between the urban landscape and a policy scenario that defines the importance, or priorities, that the authority places on four criteria.
Neighborhoods respond to the water authority decisions by protesting against the lack of investment and the level of exposure to water scarcity and flooding. Protests thus simulate a form of feedback between local-level outcomes (flooding and water scarcity) and higher-level decision-making. Neighborhoods at high altitude are more likely to be exposed to water scarcity and lack infrastructure, whereas neighborhoods in the lowlands tend to suffer from recurrent flooding. The frequency of flooding is also a function of spatially uniform rainfall events. Likewise, neighborhoods at the periphery of the urban landscape lack infrastructure and suffer from chronic risk of water scarcity.
The model simulates the coupling between the decision-making processes of institutional actors, socio-political processes and infrastructure-related hazards. In the documentation, we describe details of the implementation in NetLogo, the description of the procedures, scheduling, and the initial conditions of the landscape and the neighborhoods.
This work was supported by the National Science Foundation under Grant No. 1414052, CNH: The Dynamics of Multi-Scalar Adaptation in Megacities (PI Hallie Eakin).
An ABM of historic British milk consumption
Matthew Gibson | Published Monday, December 20, 2021Substitution of food products will be key to realising widespread adoption of sustainable diets. We present an agent-based model of decision-making and influences on food choice, and apply it to historically observed trends of British whole and skimmed (including semi) milk consumption from 1974 to 2005. We aim to give a plausible representation of milk choice substitution, and test different mechanisms of choice consideration. Agents are consumers that perceive information regarding the two milk choices, and hold values that inform their position on the health and environmental impact of those choices. Habit, social influence and post-decision evaluation are modelled. Representative survey data on human values and long-running public concerns empirically inform the model. An experiment was run to compare two model variants by how they perform in reproducing these trends. This was measured by recording mean weekly milk consumption per person. The variants differed in how agents became disposed to consider alternative milk choices. One followed a threshold approach, the other was probability based. All other model aspects remained unchanged. An optimisation exercise via an evolutionary algorithm was used to calibrate the model variants independently to observed data. Following calibration, uncertainty and global variance-based temporal sensitivity analysis were conducted. Both model variants were able to reproduce the general pattern of historical milk consumption, however, the probability-based approach gave a closer fit to the observed data, but over a wider range of uncertainty. This responds to, and further highlights, the need for research that looks at, and compares, different models of human decision-making in agent-based and simulation models. This study is the first to present an agent-based modelling of food choice substitution in the context of British milk consumption. It can serve as a valuable pre-curser to the modelling of dietary shift and sustainable product substitution to plant-based alternatives in Britain.
3D Urban Traffic Simulator (ABM) in Unity
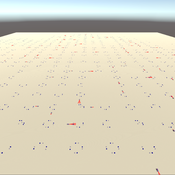
Daniel Birks Sedar Olmez Obi Thompson Sargoni Alison Heppenstall Annabel Whipp Ed Manley | Published Friday, January 22, 2021 | Last modified Monday, March 22, 2021The Urban Traffic Simulator is an agent-based model developed in the Unity platform. The model allows the user to simulate several autonomous vehicles (AVs) and tune granular parameters such as vehicle downforce, adherence to speed limits, top speed in mph and mass. The model allows researchers to tune these parameters, run the simulator for a given period and export data from the model for analysis (an example is provided in Jupyter Notebook).
The data the model is currently able to output are the following:
…
01a ModEco V2.05 – Model Economies – In C++
Garvin Boyle | Published Monday, February 04, 2013 | Last modified Friday, April 14, 2017Perpetual Motion Machine - A simple economy that operates at both a biophysical and economic level, and is sustainable. The goal: to determine the necessary and sufficient conditions of sustainability, and the attendant necessary trade-offs.
Ant Colony Optimization for infrastructure routing
Igor Nikolic Emile Chappin P W Heijnen | Published Wednesday, March 05, 2014 | Last modified Saturday, March 24, 2018The mode implements a variant of Ant Colony Optimization to explore routing on infrastructures through a landscape with forbidden zones, connecting multiple sinks to one source.
Displaying 10 of 439 results for "Therese Lindahl" clear search
