Our mission is to help computational modelers develop, document, and share their computational models in accordance with community standards and good open science and software engineering practices. Model authors can publish their model source code in the Computational Model Library with narrative documentation as well as metadata that supports open science and emerging norms that facilitate software citation, computational reproducibility / frictionless reuse, and interoperability. Model authors can also request private peer review of their computational models. Models that pass peer review receive a DOI once published.
All users of models published in the library must cite model authors when they use and benefit from their code.
Please check out our model publishing tutorial and feel free to contact us if you have any questions or concerns about publishing your model(s) in the Computational Model Library.
Displaying 10 of 104 results for "María Victoria de-la-Fuente-Aragon" clear search
MarPEM: An Agent Based Model to Explore the Effects of Policy Instruments on the Transition of the Maritime Fuel System
G Bas K De Boo Am Vaes - Van De Hulsbeek I Nikolic | Published Thursday, June 15, 2017MarPEM is an agent-based model that can be used to study the effects of policy instruments on the transition away from HFO.
Peer reviewed Gradient Descent Simulation
Ilyes Azouani | Published Wednesday, March 18, 2026 | Last modified Monday, May 25, 2026This model visualizes gradient descent optimization - the fundamental algorithm used to train neural networks and other machine learning models. Agents represent different optimization algorithms searching for the minimum of a loss landscape (the “error surface” that ML models try to minimize during training).
The model demonstrates how different optimizer types (SGD, Momentum with different parameters) behave on various loss landscapes, from simple bowls to the notoriously difficult Rosenbrock “banana valley” function. This helps build intuition about why certain optimization algorithms work better than others for different problem geometries.
HOW IT WORKS
…
Information Spread
Aaron Beck | Published Thursday, December 02, 2021Our model shows how disinformation spreads on a random network of individuals. The network is weighted and directed. We are looking at how different factors affect how fast, or how many people get “infected” with the misinformation. One of the main factors that we were curious about was perceived trustworthiness. This is because we want to see if people of power, or a high degree of perceived trustworthiness, were able to push misinformation to more people and convert more people to believe the information.
A Simple Agent Based Modeling Tool for Plastic and Debris Tracking in Oceans
Koushik Sura Bhaskar Subu Kandaswamy Sai Amulya Murukutla Sai Pranay Raju Chinthala Abhishek Bobbillapati | Published Monday, October 04, 2021Plastics and the pollution caused by their waste have always been a menace to both nature and humans. With the continual increase in plastic waste, the contamination due to plastic has stretched to the oceans. Many plastics are being drained into the oceans and rose to accumulate in the oceans. These plastics have seemed to form large patches of debris that keep floating in the oceans over the years. Identification of the plastic debris in the ocean is challenging and it is essential to clean plastic debris from the ocean. We propose a simple tool built using the agent-based modeling framework NetLogo. The tool uses ocean currents data and plastic data both being loaded using GIS (Geographic Information System) to simulate and visualize the movement of floatable plastic and debris in the oceans. The tool can be used to identify the plastic debris that has been piled up in the oceans. The tool can also be used as a teaching aid in classrooms to bring awareness about the impact of plastic pollution. This tool could additionally assist people to realize how a small plastic chunk discarded can end up as large debris drifting in the oceans. The same tool might help us narrow down the search area while looking out for missing cargo and wreckage parts of ships or flights. Though the tool does not pinpoint the location, it might help in reducing the search area and might be a rudimentary alternative for more computationally expensive models.
A Toy Model for the Abilene Paradox
Victor Sahin | Published Monday, June 17, 2019 | Last modified Sunday, July 14, 2019This version adds a Maslowian entropy to each agent decision based on Kendrick et. al. Rudimentary implementation assumes agents with lower scores are more likely to make decisions autonomously rather than sociotropically.
Decision Models for Generalized Price's Equation and Companion Code
Victor Sahin | Published Tuesday, July 02, 2019This is a series of simulations of binary group decisions and the outcomes applied to a generalized version of Price’s Equation for system fitness.
Cellular automata model of social networks
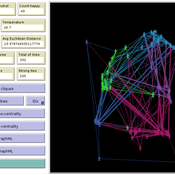
Rubens de Almeida Zimbres | Published Tuesday, August 02, 2022This project was developed during the Santa Fe course Introduction to Agent-Based Modeling 2022. The origin is a Cellular Automata (CA) model to simulate human interactions that happen in the real world, from Rubens and Oliveira (2009). These authors used a market research with real people in two different times: one at time zero and the second at time zero plus 4 months (longitudinal market research). They developed an agent-based model whose initial condition was inherited from the results of the first market research response values and evolve it to simulate human interactions with Agent-Based Modeling that led to the values of the second market research, without explicitly imposing rules. Then, compared results of the model with the second market research. The model reached 73.80% accuracy.
In the same way, this project is an Exploratory ABM project that models individuals in a closed society whose behavior depends upon the result of interaction with two neighbors within a radius of interaction, one on the relative “right” and other one on the relative “left”. According to the states (colors) of neighbors, a given cellular automata rule is applied, according to the value set in Chooser. Five states were used here and are defined as levels of quality perception, where red (states 0 and 1) means unhappy, state 3 is neutral and green (states 3 and 4) means happy.
There is also a message passing algorithm in the social network, to analyze the flow and spread of information among nodes. Both the cellular automaton and the message passing algorithms were developed using the Python extension. The model also uses extensions csv and arduino.
Shellmound Mobility
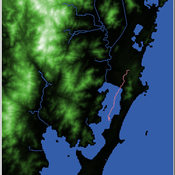
Henrique de Sena Kozlowski | Published Saturday, June 15, 2024Least Cost Path (LCP) analysis is a recurrent theme in spatial archaeology. Based on a cost of movement image, the user can interpret how difficult it is to travel around in a landscape. This kind of analysis frequently uses GIS tools to assess different landscapes. This model incorporates some aspects of the LCP analysis based on GIS with the capabilities of agent-based modeling, such as the possibility to simulate random behavior when moving. In this model the agent will travel around the coastal landscape of Southern Brazil, assessing its path based on the different cost of travel through the patches. The agents represent shellmound builders (sambaquieiros), who will travel mainly through the use of canoes around the lagoons.
How it works?
When the simulation starts the hiker agent moves around the world, a representation of the lagoon landscape of the Santa Catarina state in Southern Brazil. The agent movement is based on the travel cost of each patch. This travel cost is taken from a cost surface raster created in ArcMap to represent the different cost of movement around the landscape. Each tick the agent will have a chance to select the best possible patch to move in its Field of View (FOV) that will take it towards its target destination. If it doesn’t select the best possible patch, it will randomly choose one of the patches to move in its FOV. The simulation stops when the hiker agent reaches the target destination. The elevation raster file and the cost surface map are based on a 1 Arc-second (30m) resolution SRTM image, scaled down 5 times. Each patch represents a square of 150m, with an area of 0,0225km². The dataset uses a UTM Sirgas 2000 22S projection system. There are four different cost functions available to use. They change the cost surface used by the hikers to navigate around the world.
Shellmound Trade
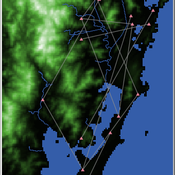
Henrique de Sena Kozlowski | Published Saturday, June 15, 2024This model simulates different trade dynamics in shellmound (sambaqui) builder communities in coastal Southern Brazil. It features two simulation scenarios, one in which every site is the same and another one testing different rates of cooperation. The purpose of the model is to analyze the networks created by the trade dynamics and explore the different ways in which sambaqui communities were articulated in the past.
How it Works?
There are a few rules operating in this model. In either mode of simulation, each tick the agents will produce an amount of resources based on the suitability of the patches inside their occupation-radius, after that the procedures depend on the trade dynamic selected. For BRN? the agents will then repay their owed resources, update their reputation value and then trade again if they need to. For GRN? the agents will just trade with a connected agent if they need to. After that the agents will then consume a random amount of resources that they own and based on that they will grow (split) into a new site or be removed from the simulation. The simulation runs for 1000 ticks. Each patch correspond to a 300x300m square of land in the southern coast of Santa Catarina State in Brazil. Each agent represents a shellmound (sambaqui) builder community. The data for the world were made from a SRTM raster image (1 arc-second) in ArcMap. The sites can be exported into a shapefile (.shp) vector to display in ArcMap. It uses a UTM Sirgas 2000 22S projection system.
Two agent-based models of cooperation in dynamic groups and fixed social networks
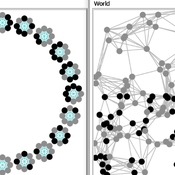
Carlos A. de Matos Fernandes | Published Thursday, January 20, 2022Both models simulate n-person prisoner dilemma in groups (left figure) where agents decide to C/D – using a stochastic threshold algorithm with reinforcement learning components. We model fixed (single group ABM) and dynamic groups (bad-barrels ABM). The purpose of the bad-barrels model is to assess the impact of information during meritocratic matching. In the bad-barrels model, we incorporated a multidimensional structure in which agents are also embedded in a social network (2-person PD). We modeled a random and homophilous network via a random spatial graph algorithm (right figure).
Displaying 10 of 104 results for "María Victoria de-la-Fuente-Aragon" clear search