Our mission is to help computational modelers develop, document, and share their computational models in accordance with community standards and good open science and software engineering practices. Model authors can publish their model source code in the Computational Model Library with narrative documentation as well as metadata that supports open science and emerging norms that facilitate software citation, computational reproducibility / frictionless reuse, and interoperability. Model authors can also request private peer review of their computational models. Models that pass peer review receive a DOI once published.
All users of models published in the library must cite model authors when they use and benefit from their code.
Please check out our model publishing tutorial and feel free to contact us if you have any questions or concerns about publishing your model(s) in the Computational Model Library.
Displaying 10 of 381 results for "Puqing Wang" clear search

How to not get stuck – an ant model showing how negative feedback due to crowding maintains flexibility in ant foraging
Tomer Czaczkes | Published Thursday, December 17, 2015Positive feedback can lead to “trapping” in local optima. Adding a simple negative feedback effect, based on ant behaviour, prevents this trapping
01b ModEco NLG V1.39 – Model Economies – The PMM
Garvin Boyle | Published Friday, April 14, 2017It is very difficult to model a sustainable intergenerational biophysical/financial economy. ModEco NLG is one of a series of models exploring the dynamics of sustainable economics – PSoup, ModEco, EiLab, OamLab, MppLab, TpLab, CmLab.
CPNorm
Ruth Meyer | Published Sunday, June 04, 2017 | Last modified Tuesday, June 13, 2017CPNorm is a model of a community of harvesters using a common pool resource where adhering to the optimal extraction level has become a social norm. The model can be used to explore the robustness of norm-driven cooperation in the commons.
Modeling a Victim-Centered Approach for Detection of Human Trafficking Victims within Migration Flows
Kyle Ballard Brant M Horio | Published Saturday, September 23, 2017The model employs an agent-based model for exploring the victim-centered approach to identifying human trafficking and the approach’s effectiveness in an abstract representation of migrant flows.
Peer reviewed COMMAND-AND-CONTROL
Farzaneh Davari | Published Tuesday, September 10, 2019 | Last modified Thursday, September 12, 2019The command and control policy in natural resource management, including water resources, is a longstanding established policy that has been theoretically and practically argued from the point of view of social-ecological complex systems. With the intention of making a system ecologically resilient, these days, policymakers apply the top-down policies of controlling communities through regulations. To explore how these policies may work and to understand whether the ecological goal can be achieved via command and control policy, this research uses the capacity of Agent-Based Modeling (ABM) as an experimental platform in the Urmia Lake Basin (ULB) in Iran, which is a social-ecological complex system and has gone through a drought process.
Despite the uncertainty of the restorability capacity of the lake, there has been a consensus on the possibility to artificially restore the lake through the nationally managed Urmia Lake Restoratoin Program (ULRP). To reduce water consumption in the Basin, the ULRP widely targets the agricultural sector and proposes the project of changing crop patterns from high-water-demand (HWD) to low-water-demand (LWD), which includes a component to control water consumption by establishing water-police forces.
Using a wide range of multidisciplinary studies about Urmia Lake at the Basin and sub-basins as well as qualitative information at micro-level as the main conceptual sources for the ABM, the findings under different strategies indicate that targeting crop patterns change by legally limiting farmers’ access to water could force farmers to change their crop patterns for a short period of time as long as the number of police constantly increases. However, it is not a sustainable policy for either changing the crop patterns nor restoring the lake.
ABM Simulation of Transition from Late Longshan Cultures to Early Erlitou Culture
Carmen Iasiello | Published Sunday, November 26, 2023Within the archeological record for Bronze Age Chinese culture, there continues to be a gap in our understanding of the sudden rise of the Erlitou State from the previous late Longshan chiefdoms. In order to examine this period, I developed and used an agent-based model (ABM) to explore possible socio-politically relevant hypotheses for the gap between the demise of the late Longshan cultures and rise of the first state level society in East Asia. I tested land use strategy making and collective action in response to drought and flooding scenarios, the two plausible environmental hazards at that time. The model results show cases of emergent behavior where an increase in social complexity could have been experienced if a catastrophic event occurred while the population was sufficiently prepared for a different catastrophe, suggesting a plausible lead for future research into determining the life of the time period.
The ABM published here was originally developed in 2016 and its results published in the Proceedings of the 2017 Winter Simulation Conference.
A Bottom-Up Simulation on Competition and Displacement of Online Interpersonal Communication Platforms
great-sage-futao | Published Tuesday, December 31, 2019 | Last modified Tuesday, December 31, 2019This model aims to simulate Competition and Displacement of Online Interpersonal Communication Platforms process from a bottom-up angle. Individual interpersonal communication platform adoption and abandonment serve as the micro-foundation of the simulation model. The evolution mode of platform user online communication network determines how present platform users adjust their communication relationships as well as how new users join that network. This evolution mode together with innovations proposed by individual interpersonal communication platforms would also have impacts on the platform competition and displacement process and result by influencing individual platform adoption and abandonment behaviors. Three scenes were designed to simulate some common competition situations occurred in the past and current time, that two homogeneous interpersonal communication platforms competed with each other when this kind of platforms first came into the public eye, that a late entrant platform with a major innovation competed with the leading incumbent platform during the following days, as well as that both the leading incumbent and the late entrant continued to propose many small innovations to compete in recent days, respectively.
Initial parameters are as follows: n(Nmax in the paper), denotes the final node number of the online communication network node. mi (m in the paper), denotes the initial degree of those initial network nodes and new added nodes. pc(Pc in the paper), denotes the proportion of links to be removed and added in each epoch. pst(Pv in the paper), denotes the proportion of nodes with a viscosity to some platforms. comeintime(Ti in the paper), denotes the epoch when Platform 2 joins the market. pit(Pi in the paper), denotes the proportion of nodes adopting Platform 2 immediately at epoch comeintime(Ti). ct(Ct in the paper), denotes the Innovation Effective Period length. In Scene 2, There is only one major platform proposed by Platform 2, and ct describes that length. However, in Scene 3, Platform 2 and 1 will propose innovations alternately. And so, we set ct=10000 in simulation program, and every jtt epochs, we alter the innovation proposer from one platform to the other. Hence in this scene, jtt actually denotes the Innovation Effective Period length instead of ct.
On July 20th, James Holmes committed a mass shooting in a midnight showing of The Dark Knight Rises. The Aurora Colorado shooting was used as a test case to validate this framework for modeling mass shootings.
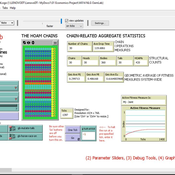
02 OamLab V1.10 - Open Atwood Machine Laboratory
Garvin Boyle | Published Saturday, January 31, 2015 | Last modified Thursday, April 13, 2017Using chains of replicas of Atwood’s Machine, this model explores implications of the Maximum Power Principle. It is one of a series of models exploring the dynamics of sustainable economics – PSoup, ModEco, EiLab, OamLab, MppLab, TpLab, EiLab.
A Simulation of Entrepreneurial Spawning
Mark Bagley | Published Wednesday, June 08, 2016 | Last modified Friday, June 30, 2017Industrial clustering patterns are the result of an entrepreneurial process where spinoffs inherit the ideas and attributes of their parent firms. This computational model maps these patterns using abstract methodologies.
Displaying 10 of 381 results for "Puqing Wang" clear search