About the CoMSES Model Library more info
Our mission is to help computational modelers develop, document, and share their computational models in accordance with community standards and good open science and software engineering practices. Model authors can publish their model source code in the Computational Model Library with narrative documentation as well as metadata that supports open science and emerging norms that facilitate software citation, computational reproducibility / frictionless reuse, and interoperability. Model authors can also request private peer review of their computational models. Models that pass peer review receive a DOI once published.
All users of models published in the library must cite model authors when they use and benefit from their code.
Please check out our model publishing tutorial and feel free to contact us if you have any questions or concerns about publishing your model(s) in the Computational Model Library.
We also maintain a curated database of over 7500 publications of agent-based and individual based models with detailed metadata on availability of code and bibliometric information on the landscape of ABM/IBM publications that we welcome you to explore.
Displaying 10 of 389 results for "Huw Vasey" clear search
Success bias imitation increases the probability of effectively dealing with ecological disturbances
Jacopo A. Baggio Vicken Hillis | Published Thursday, April 13, 2017 | Last modified Thursday, August 02, 2018This model aims to investigate how different type of learning (social system) and disturbance specific attributes (ecological system) influence adoption of treatment strategies to treat the effects of ecological disturbances.
Status hierarchies and the emergence of cooperation in task groups
Hsuan-Wei Lee | Published Thursday, January 02, 2025This repository contains an agent-based simulation model exploring how status hierarchies influence the emergence and sustainability of cooperation in task-oriented groups. The model builds on evolutionary game theory to examine the dynamics of cooperation under single-leader and multi-leader hierarchies, investigating factors such as group size, assortativity, and hierarchical clarity. Key findings highlight the trade-offs between different leadership structures in fostering group cooperation and reveal the conditions under which cooperation is most stable.
The repository includes code for simulations, numerical analysis scripts, and visualization tools to replicate the results presented in the manuscript titled “Status hierarchies and the emergence of cooperation in task groups.”
Feel free to explore, reproduce the findings, or adapt the model for further research!
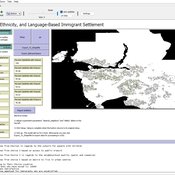
Geospatial Agent-Based Model of Immigrant Settlement Dynamics in Metro Vancouver
Liliana Perez Navid Mahdizadeh Gharakhanlou Maryam Yousefi | Published Wednesday, December 03, 2025This agent-based model simulates how new immigrant households choose where to live in Metro Vancouver under the origins diversity scenario. The model begins with 16,000 household agents, reflecting an expected annual population increase of about 42,500 people based on an average household size of 2.56. Each agent is assigned four characteristics: one of ten origin categories, income level (adjusted using NOC data and recent immigrant earnings), likelihood of having children, and preferred mode of commuting. The ten origin groups are drawn from Census patterns, including six subgroups within the broader Asian category (China, India, the Philippines, Iran, South Korea, and Other Asian countries) and two categories for immigrants from the Americas. This refined classification better captures the diversity of newcomers arriving in the region.
Individual time preferences and adoption of destructive extraction methods
Marco Janssen Aneeque Javaid Hauke Reuter Achim Schlueter | Published Tuesday, December 06, 2016We model the relationship between natural resource user´s individual time preferences and their use of destructive extraction method in the context of small-scale fisheries.
Peer reviewed Infectious diseases model for mixed-methods research chapter
Mark Moritz Ian M Hamilton Chelsea E Hunter Daniel C Peart | Published Sunday, January 30, 2022The purpose of this curricular model is to teach students the basics of modeling complex systems using agent-based modeling. It is a simple SIR model that simulates how a disease spreads through a population as its members change from susceptible to infected to recovered and then back to susceptible. The dynamics of the model are such that there are multiple emergent outcomes depending on the parameter settings, initial conditions, and chance.
The curricular model can be used with the chapter Agent-Based Modeling in Mixed Methods Research (Moritz et al. 2022) in the Handbook of Teaching Qualitative & Mixed Methods (Ruth et al. 2022).
The instructional videos can be accessed on YouTube: Video 1 (https://youtu.be/32_JIfBodWs); Video 2 (https://youtu.be/0PK_zVKNcp8); and Video 3 (https://youtu.be/0bT0_mYSAJ8).
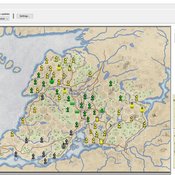
ThomondSim
Vinicius Marino Carvalho | Published Monday, April 25, 2022 | Last modified Friday, May 12, 2023ThomondSim is a simulation of the political and economic landscape of the medieval kingdom of Thomond, southwestern Ireland, between 1276 and 1318.
Its goal is to analyze how deteriorating environmental and economic conditions caused by the Little Ice Age (LIA), the Great European Famine of 1315-1322, and wars between England and Scotland affected the outcomes of a local war involving Gaelic and English aristocratic lineages.
This ABM attempts to model both the effects of devastation on the human environment and the modus operandi of late-medieval war and diplomacy.
The model is the digital counterpart of the science discovery board game The Triumphs of Turlough. Its procedures closely correspond to the game’s mechanics, to the point that ToT can be considered an interactive, analog version of this ABM.
Cultural transmission in structured populations
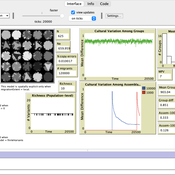
Luke Premo | Published Wednesday, November 13, 2024This structured population model is built to address how migration (or intergroup cultural transmission), copying error, and time-averaging affect regional variation in a single selectively neutral discrete cultural trait under different mechanisms of cultural transmission. The model allows one to quantify cultural differentiation between groups within a structured population (at equilibrium) as well as between regional assemblages of time-averaged archaeological material at two different temporal scales (1,000 and 10,000 ticks). The archaeological assemblages begin to accumulate only after a “burn-in” period of 10,000 ticks. The model includes two different representations of copying error: the infinite variants model of copying error and the finite model of copying error. The model also allows the user to set the variant ceiling value for the trait in the case of the finite model of copying error.
The influence of cognitive diversity on networked search and coordination
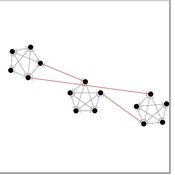
César García-Díaz | Published Wednesday, April 03, 2024Agent-based models of organizational search have long investigated how exploitative and exploratory behaviors shape and affect performance on complex landscapes. To explore this further, we build a series of models where agents have different levels of expertise and cognitive capabilities, so they must rely on each other’s knowledge to navigate the landscape. Model A investigates performance results for efficient and inefficient networks. Building on Model B, it adds individual-level cognitive diversity and interaction based on knowledge similarity. Model C then explores the performance implications of coordination spaces. Results show that totally connected networks outperform both hierarchical and clustered network structures when there are clear signals to detect neighbor performance. However, this pattern is reversed when agents must rely on experiential search and follow a path-dependent exploration pattern.
Exploring the Potential of Conversational AI Support for Agent-Based Social Simulation Model Design
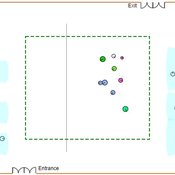
Peer-Olaf Siebers | Published Sunday, May 12, 2024Our aim is to demonstrate how conversational AI systems, exemplified by ChatGPT, can support the conceptualisation of Agent-Based Social Simulation (ABSS) models, leading to a full ABSS model design document. Through advanced prompt engineering and adherence to the Engineering ABSS framework (Siebers and Klügl 2017), we have constructed a comprehensive script that is easy to use and that supports the design of ABSS models with or even by AI. The performance of the script is demonstrated through an illustrative case study related to the use of adaptive architecture in museums. The repository contains (1) the comprehensive script in a format that allows copying and pasting prompts for use with ChatGPT, (2) the results of the illustrative case study in the form of two conceptual ABSS models, the ground truth and the autogenerated version.
Displaying 10 of 389 results for "Huw Vasey" clear search