Our mission is to help computational modelers develop, document, and share their computational models in accordance with community standards and good open science and software engineering practices. Model authors can publish their model source code in the Computational Model Library with narrative documentation as well as metadata that supports open science and emerging norms that facilitate software citation, computational reproducibility / frictionless reuse, and interoperability. Model authors can also request private peer review of their computational models. Models that pass peer review receive a DOI once published.
All users of models published in the library must cite model authors when they use and benefit from their code.
Please check out our model publishing tutorial and feel free to contact us if you have any questions or concerns about publishing your model(s) in the Computational Model Library.
Displaying 10 of 997 results for "Dave van Wees" clear search
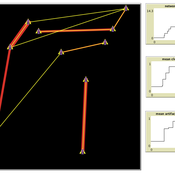
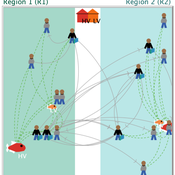
Peer reviewed Visibility of archaeological social networks
Claudine Gravel-Miguel | Published Sunday, November 26, 2023The purpose of this model is to explore the impact of combining archaeological palimpsests with different methods of cultural transmission on the visibility of prehistoric social networks. Up until recently, Paleolithic archaeologists have relied on stylistic similarities of artifacts to reconstruct social networks. However, this method - which is successfully applied to more recent ceramic assemblages - may not be applicable to Paleolithic assemblages, as several of those consist of palimpsests of occupations. Therefore, this model was created to study how palimpsests of occupation affect our social network reconstructions.
The model simplifies inter-groups interactions between populations who share cultural traits as they produce artifacts. It creates a proxy archaeological record of artifacts with stylistic traits that can then be used to reconstruct interactions. One can thus use this model to compare the networks reconstructed through stylistic similarities with direct contact.
Modeling Personal Carbon Trading with ABM
Roman Seidl | Published Friday, December 07, 2018 | Last modified Thursday, July 29, 2021A simulated approach for Personal Carbon Trading, for figuring out what effects it might have if it will be implemented in the real world. We use an artificial population with some empirical data from international literature and basic assumptions about heterogeneous energy demand. The model is not to be used as simulating the actual behavior of real populations, but a toy model to test the effects of differences in various factors such as number of agents, energy price, price of allowances, etc. It is important to adapt the model for specific countries as carbon footprint and energy demand determines the relative success of PCT.
Peer reviewed DogFoxCDVspillover
Aniruddha Belsare Matthew Gompper | Published Thursday, March 16, 2017 | Last modified Tuesday, April 04, 2017The purpose of this model is to better understand the dynamics of a multihost pathogen in two host system comprising of high densities of domestic hosts and sympatric wildlife hosts susceptible to the pathogen.
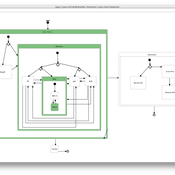
DiDIY Factory
Ruth Meyer | Published Tuesday, February 20, 2018The DiDIY-Factory model is a model of an abstract factory. Its purpose is to investigate the impact Digital Do-It-Yourself (DiDIY) could have on the domain of work and organisation.
DiDIY can be defined as the set of all manufacturing activities (and mindsets) that are made possible by digital technologies. The availability and ease of use of digital technologies together with easily accessible shared knowledge may allow anyone to carry out activities that were previously only performed by experts and professionals. In the context of work and organisations, the DiDIY effect shakes organisational roles by such disintermediation of experts. It allows workers to overcome the traditionally strict organisational hierarchies by having direct access to relevant information, e.g. the status of machines via real-time information systems implemented in the factory.
A simulation model of this general scenario needs to represent a more or less abstract manufacturing firm with supervisors, workers, machines and tasks to be performed. Experiments with such a model can then be run to investigate the organisational structure –- changing from a strict hierarchy to a self-organised, seemingly anarchic organisation.
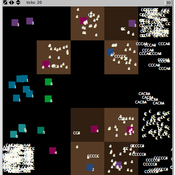
Peer reviewed Small-Trade Model
Emilie Lindkvist Maja Schlüter Blanca Gonzalez-Mon Örjan Bodin | Published Wednesday, July 28, 2021The purpose of this model is to understand the role of trade networks and their interaction with different fish resources, for fish provision. The model is developed based on a multi-methods approach, combining agent-based modeling, network analysis and qualitative data based on a small-scale fisheries study case. The model can be used to investigate both how trade network structures are embedded in a social-ecological context and the trade processes that occur within them, to analyze how they lead to emergent outcomes related to the resilience of fish provision. The model processes are informed by qualitative data analysis, and the social network analysis of an empirical fish trade network. The network analysis can be used to investigate diverse network structures to perform model experiments, and their influence on model outcomes.
The main outcomes we study are 1) the overexploitation of fish resources and 2) the availability and variability of fish provision to satisfy different market demands, and 3) individual traders’ fish supply at the micro-level. The model has two types of trader agents, seller and dealer. The model reveals that the characteristics of the trade networks, linked to different trader types (that have different roles in those networks), can affect the resilience of fish provision.
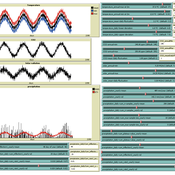
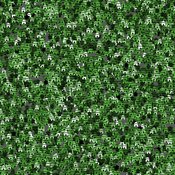
Peer reviewed The Indus Village's Weather model: procedural generation of daily weather
Andreas Angourakis | Published Tuesday, May 13, 2025Overview
The Weather model is a procedural generation model designed to create realistic daily weather data for socioecological simulations. It generates synthetic weather time series for solar radiation, temperature, and precipitation using algorithms based on sinusoidal and double logistic functions. The model incorporates stochastic variation to mimic unpredictable weather patterns and aims to provide realistic yet flexible weather inputs for exploring diverse climate scenarios.
The Weather model can be used independently or integrated into larger models, providing realistic weather patterns without extensive coding or data collection. It can be customized to meet specific requirements, enabling users to gain a better understanding of the underlying mechanisms and have greater confidence in their applications.
…
Life Cycle Cost of Military Manpower Model
Jonathan Ozik Todd Combs | Published Monday, January 05, 2015We demonstrate how Repast Simphony statecharts can efficiently encapsulate the deep classification hierarchy of the U.S. Air Force for manpower life cycle costing.
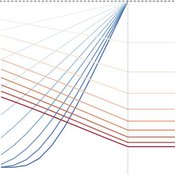
Peer reviewed Price Evolution with Expectations
J M Applegate Gesine Steudel Armin Haas Carlo Jaeger | Published Friday, September 10, 2021The Price Evolution with Expectations model provides the opportunity to explore the question of non-equilibrium market dynamics, and how and under which conditions an economic system converges to the classically defined economic equilibrium. To accomplish this, we bring together two points of view of the economy; the classical perspective of general equilibrium theory and an evolutionary perspective, in which the current development of the economic system determines the possibilities for further evolution.
The Price Evolution with Expectations model consists of a representative firm producing no profit but producing a single good, which we call sugar, and a representative household which provides labour to the firm and purchases sugar.The model explores the evolutionary dynamics whereby the firm does not initially know the household demand but eventually this demand and thus the correct price for sugar given the household’s optimal labour.
The model can be run in one of two ways; the first does not include money and the second uses money such that the firm and/or the household have an endowment that can be spent or saved. In either case, the household has preferences for leisure and consumption and a demand function relating sugar and price, and the firm has a production function and learns the household demand over a set number of time steps using either an endogenous or exogenous learning algorithm. The resulting equilibria, or fixed points of the system, may or may not match the classical economic equilibrium.
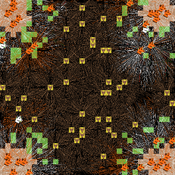
Viability analysis of a population submitted to floods
Sophie Martin | Published Wednesday, September 22, 2021This model computes the guaranteed viability kernel of a model describing the evolution of a population submitted to successive floods.
The population is described by its wealth and its adaptation rate to floods, the control are information campaigns that have a cost but increase the adaptation rate and the expected successive floods belong to given set defined by the maximal high and the minimal time between two floods.
Peninsula_Iberica 1.0
Carolina Cucart-Mora Sergi Lozano Javier Fernández-López De Pablo | Published Friday, November 04, 2016 | Last modified Monday, November 27, 2017This model was build to explore the bio-cultural interaction between AMH and Neanderthals during the Middle to Upper Paleolithic Transition in the Iberian Peninsula
Displaying 10 of 997 results for "Dave van Wees" clear search