Our mission is to help computational modelers develop, document, and share their computational models in accordance with community standards and good open science and software engineering practices. Model authors can publish their model source code in the Computational Model Library with narrative documentation as well as metadata that supports open science and emerging norms that facilitate software citation, computational reproducibility / frictionless reuse, and interoperability. Model authors can also request private peer review of their computational models. Models that pass peer review receive a DOI once published.
All users of models published in the library must cite model authors when they use and benefit from their code.
Please check out our model publishing tutorial and feel free to contact us if you have any questions or concerns about publishing your model(s) in the Computational Model Library.
Displaying 10 of 191 results for "M Bockarjova" clear search
MCA-SdA (ABM of mining-community-aquifer interactions in Salar de Atacama, Chile)
Wenjuan Liu | Published Tuesday, December 01, 2020 | Last modified Thursday, November 04, 2021This model represnts an unique human-aquifer interactions model for the Li-extraction in Salar de Atacama, Chile. It describes the local actors’ experience of mining-induced changes in the socio-ecological system, especially on groundwater changes and social stressors. Social interactions are designed specifically according to a long-term local fieldwork by Babidge et al. (2019, 2020). The groundwater system builds on the FlowLogo model by Castilla-Rho et al. (2015), which was then parameterized and calibrated with local hydrogeological inputs in Salar de Atacama, Chile. The social system of the ABM is defined and customozied based on empirical studies to reflect three major stressors: drought stress, population stress, and mining stress. The model reports evolution of groundwater changes and associated social stress dynamics within the modeled time frame.
Peer reviewed SIM-VOLATILE: Adoption of emerging circular technologies in the waste-treatment sector
Siavash Farahbakhsh | Published Wednesday, December 14, 2022The SIM-VOLATILE model is a technology adoption model at the population level. The technology, in this model, is called Volatile Fatty Acid Platform (VFAP) and it is in the frame of the circular economy. The technology is considered an emerging technology and it is in the optimization phase. Through the adoption of VFAP, waste-treatment plants will be able to convert organic waste into high-end products rather than focusing on the production of biogas. Moreover, there are three adoption/investment scenarios as the technology enables the production of polyhydroxyalkanoates (PHA), single-cell oils (SCO), and polyunsaturated fatty acids (PUFA). However, due to differences in the processing related to the products, waste-treatment plants need to choose one adoption scenario.
In this simulation, there are several parameters and variables. Agents are heterogeneous waste-treatment plants that face the problem of circular economy technology adoption. Since the technology is emerging, the adoption decision is associated with high risks. In this regard, first, agents evaluate the economic feasibility of the emerging technology for each product (investment scenarios). Second, they will check on the trend of adoption in their social environment (i.e. local pressure for each scenario). Third, they combine these two economic and social assessments with an environmental assessment which is their environmental decision-value (i.e. their status on green technology). This combination gives the agent an overall adaptability fitness value (detailed for each scenario). If this value is above a certain threshold, agents may decide to adopt the emerging technology, which is ultimately depending on their predominant adoption probabilities and market gaps.
FlowLogo for a real case study
Vahid Aghaie | Published Monday, May 18, 2020Juan Castilla-Rho et al. (2015) developed a platform, named FLowLogo, which integrates a 2D, finite-difference solution of the governing equations of groundwater flow with agent-based simulation. We used this model for Rafsanjan Aquifer, which is located in an arid region in Iran. To use FLowLogo for a real case study, one needs to add GIS shapefiles of boundary conditions and modify the code written in NetLogo a little bit. The FlowLogo model used in our research is presented here.
Peer reviewed Neighbor Influenced Energy Retrofit (NIER) agent-based model
Eric Boria | Published Friday, April 03, 2020The NIER model is intended to add qualitative variables of building owner types and peer group scales to existing energy efficiency retrofit adoption models. The model was developed through a combined methodology with qualitative research, which included interviews with key stakeholders in Cleveland, Ohio and Detroit and Grand Rapids, Michigan. The concepts that the NIER model adds to traditional economic feasibility studies of energy retrofit decision-making are differences in building owner types (reflecting strategies for managing buildings) and peer group scale (neighborhoods of various sizes and large-scale Districts). Insights from the NIER model include: large peer group comparisons can quickly raise the average energy efficiency values of Leader and Conformist building owner types, but leave Stigma-avoider owner types as unmotivated to retrofit; policy interventions such as upgrading buildings to energy-related codes at the point of sale can motivate retrofits among the lowest efficient buildings, which are predominantly represented by the Stigma-avoider type of owner; small neighborhood peer groups can successfully amplify normal retrofit incentives.
Port of Mars simplified
Marco Janssen | Published Tuesday, January 14, 2020This is a simulation model to explore possible outcomes of the Port of Mars cardgame. Port of Mars is a resource allocation game examining how people navigate conflicts between individual goals and common interests relative to shared resources. The game involves five players, each of whom must decide how much of their time and effort to invest in maintaining public infrastructure and renewing shared resources and how much to expend in pursuit of their individual goals. In the game, “Upkeep” is a number that represents the physical health of the community. This number begins at 100 and goes down by twenty-five points each round, representing resource consumption and wear and tear on infrastructure. If that number reaches zero, the community collapses and everyone dies.
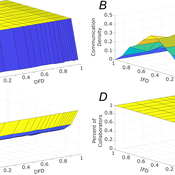
Role of Diversity in Team Performance: the Case of Missing Expertise, an Agent Based Simulations
Tamás Kiss | Published Friday, December 29, 2023This ABM simulates problem solving agents as they work on a set of tasks. Each agent has a trait vector describing their skills. Two agents might form a collaboration if their traits are similar enough. Tasks are defined by a component vector. Agents work on tasks by decreasing tasks’ component vectors towards zero.
The simulation generates agents with given intrapersonal functional diversity (IFD), and dominant function diversity (DFD), and a set of random tasks and evaluates how agents’ traits influence their level of communication and the performance of a team of agents.
Modeling results highlight the importance of the distributions of agents’ properties forming a team, and suggests that for a thorough description of management teams, not only diversity measures based on individual agents, but an aggregate measure is also required.
…
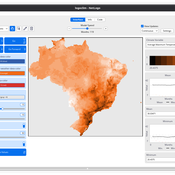
LogoClim: WorldClim in NetLogo
Daniel Vartanian Leandro Garcia Aline Martins de Carvalho Aline | Published Thursday, July 03, 2025 | Last modified Monday, July 13, 2026LogoClim is a NetLogo model designed to be integrated into other simulations through the LevelSpace extension (Hjorth et al., 2020), providing high resolution climate data from sources validated and used by the Intergovernmental Panel on Climate Change (IPCC).
The model simplifies and standardizes the integration of climate data into NetLogo, allowing researchers to focus their efforts on the model itself with the assurance of using reliable and widely recognized data. Although its main use is as a component of larger simulations, LogoClim also has its own graphical interface for monitoring and checking the datasets.
The climate data comes from the WorldClim 2.1 project (Fick & Hijmans, 2017), for which LogoClim works as an interface to NetLogo. The model supports all three WorldClim data series: (1) Historical Climate Data (1970 to 2000), with 12 monthly points for minimum, mean, and maximum temperature, precipitation, solar radiation, wind speed, vapor pressure, elevation, and bioclimatic variables; (2) Historical Monthly Weather Data (1951 to 2024), based on downscaling of CRU-TS-4.09, developed by the Climatic Research Unit at the University of East Anglia (Harris et al., 2020), with minimum and maximum temperature and total precipitation; and (3) Future Climate Data, based on downscaling climate projections derived from global climate models of the Coupled Model Intercomparison Project Phase 6 (CMIP6) (Eyring et al., 2016) for four future periods (2021 to 2040, 2041 to 2060, 2061 to 2080, and 2081 to 2100) and four scenarios based on the Shared Socioeconomic Pathways (SSPs 126, 245, 370, and 585), covering minimum and maximum temperature, total precipitation, and bioclimatic variables. All series are available at multiple spatial resolutions, from 10 minutes (about 340 km² at the equator) to 30 seconds (about 1 km² at the equator).
…
Peer reviewed Dynamic Value-based Cognitive Architectures
Bart de Bruin | Published Tuesday, November 30, 2021The intention of this model is to create an universal basis on how to model change in value prioritizations within social simulation. This model illustrates the designing of heterogeneous populations within agent-based social simulations by equipping agents with Dynamic Value-based Cognitive Architectures (DVCA-model). The DVCA-model uses the psychological theories on values by Schwartz (2012) and character traits by McCrae and Costa (2008) to create an unique trait- and value prioritization system for each individual. Furthermore, the DVCA-model simulates the impact of both social persuasion and life-events (e.g. information, experience) on the value systems of individuals by introducing the innovative concept of perception thermometers. Perception thermometers, controlled by the character traits, operate as buffers between the internal value prioritizations of agents and their external interactions. By introducing the concept of perception thermometers, the DVCA-model allows to study the dynamics of individual value prioritizations under a variety of internal and external perturbations over extensive time periods. Possible applications are the use of the DVCA-model within artificial sociality, opinion dynamics, social learning modelling, behavior selection algorithms and social-economic modelling.
Peer reviewed Descriptive Norm and Fraud Dynamics
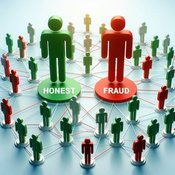
Alexandra Eckert Matthias Meyer Christian Stindt | Published Tuesday, January 07, 2025 | Last modified Tuesday, March 24, 2026The “Descriptive Norm and Fraud Dynamics” model demonstrates how fraudulent behavior can either proliferate or be contained within non-hierarchical organizations, such as peer networks, through social influence taking the form of a descriptive norm. This model expands on the fraud triangle theory, which posits that an individual must concurrently possess a financial motive, perceive an opportunity, and hold a pro-fraud attitude to engage in fraudulent activities (red agent). In the absence of any of these elements, the individual will act honestly (green agent).
The model explores variations in a descriptive norm mechanism, ranging from local distorted knowledge to global perfect knowledge. In the case of local distorted knowledge, agents primarily rely on information from their first-degree colleagues. This knowledge is often distorted because agents are slow to update their empirical expectations, which are only partially revised after one-to-one interactions. On the other end of the spectrum, local perfect knowledge is achieved by incorporating a secondary source of information into the agents’ decision-making process. Here, accurate information provided by an observer is used to update empirical expectations.
The model shows that the same variation of the descriptive norm mechanism could lead to varying aggregate fraud levels across different fraud categories. Two empirically measured norm sensitivity distributions associated with different fraud categories can be selected into the model to see the different aggregate outcomes.
Fragile, Resilient, Asymmetric: An Agent-Based Stress Test of European Cooperation under Geopolitical Shocks (2024–2040)
Alessandro Brugnoletti | Published Tuesday, August 25, 2026Agent-based model of cooperation among fourteen EU member states under geopolitical shocks, 2024-2040. States are adaptive agents on the observed intra-EU trade network, updating a cooperation propensity through inertia, network influence, and a repeated-game payoff structure built from verified Eurostat, Eurobarometer and IMF data. An anchoring device makes the observed 2024 configuration exactly stationary absent shocks, so results are read as deviations from an empirical baseline. Five scenarios of increasing severity are simulated with Monte Carlo replication, up to an extreme counterfactual crisis in the Taiwan Strait. Includes six robustness batteries and a full ODD description.
Displaying 10 of 191 results for "M Bockarjova" clear search