Our mission is to help computational modelers develop, document, and share their computational models in accordance with community standards and good open science and software engineering practices. Model authors can publish their model source code in the Computational Model Library with narrative documentation as well as metadata that supports open science and emerging norms that facilitate software citation, computational reproducibility / frictionless reuse, and interoperability. Model authors can also request private peer review of their computational models. Models that pass peer review receive a DOI once published.
All users of models published in the library must cite model authors when they use and benefit from their code.
Please check out our model publishing tutorial and feel free to contact us if you have any questions or concerns about publishing your model(s) in the Computational Model Library.
Displaying 10 of 111 results R clear search
Margin League: Elo forecasts, bookmaker margin and the favourite-longshot pattern
Edward | Published Sunday, November 15, 2026An agent-based model of a sports league, a public Elo forecaster and a bookmaker. Teams have hidden true strengths that drift between seasons; the forecaster updates Elo ratings after every game; the bookmaker prices each game from the Elo forecast plus a margin (overround), spread either proportionally or loaded onto longshot prices. The model asks where the favourite-longshot pattern in betting prices comes from. With a forecaster whose ratings lag true strength, longshots win more often than their de-vigged price implies; a bookmaker that loads its margin onto longshots cancels that bias, so favourite and longshot bets both lose roughly the margin. Outputs: a calibration table (de-vigged price band vs. observed win rate) and the average return of flat bets on favourites and longshots. Python 3 standard library only; all parameters are command-line arguments; the README documents the model with a short ODD protocol and an example run. Companion empirical study and open data (CC BY 4.0): Bet Better market calibration study. Teaching model, not a betting system.
Flocking 3D Market: Social Proof and Congestion in a Multi-Floor Market
mmjqaq | Published Saturday, November 14, 2026A NetLogo 3D 7.0 model of a market with several floors. Buyers walk, keep their distance from one another, choose among the stalls they can see and change floors. Social proof acts on where buyers go (attraction) and on whether they buy (conversion), and crowding lowers the chance of a purchase. The model tests whether social proof is sufficient to congest such a market and separates the roles of influence, layout and local density. The archive contains the model with every BehaviorSpace experiment of the companion paper, all simulation outputs, the pre-analysis plan, an ODD+D description and the Python code that reproduces every reported number, table and figure.
Agent-Based Simulation of Operational and Fare Integration in Multi-Operator Bus Networks: Institutional Trade-offs and Robustness Analysis
Lorenzo Ros-McDonnell María Victoria de-la-Fuente-Aragon Salvador Martinez-Artero-Martinez Khaoula El Bied | Published Tuesday, November 03, 2026This study separates operational interoperability, fare integration and revenue-sharing governance in a stylised multi-operator bus network. An agent-based model implemented in NetLogo 7.0.3 represents passengers, buses and stations across 14 stations, nine routes and three operators. A 2 × 2 institutional design is complemented by financial clearing comparisons and 43,200 robustness runs: behavioural sensitivity (E1), a 243-configuration operational factorial (E2), and targeted joint behavioural–operational stress testing (E3). The audited experiment records show favourable interoperability effects on waiting, total travel time, transfers and realised generalised cost in all 1,944 E2 and 768 E3 configuration-level primary comparisons. Fare integration substantially reduces passenger expenditure but produces an aggregate deficit under the assumed accounting coefficients. Revenue-sharing rules redistribute operator-level outcomes without changing aggregate profit or passenger trajectories by construction. The model is intended to identify mechanisms and test conditional robustness, not predict city-specific policy effects. The paper contributes an explicit separation of access, pricing and settlement mechanisms coupled with reproducible factorial and stress-test comparisons.

Artificial Anasazi: Baseline Fixes, Dynamic Soil and Plot Crowding
Thomas Tuoti | Published Sunday, October 04, 2026Artificial Anasazi is an agent-based model of farming households in the Long House Valley, Arizona, from 800 to 1350 CE. Each household chooses where to farm and settle based on expected harvest, water sources and stored maize, and simulated household counts are compared with the archaeological record.
This release adapts the NetLogo Models Library version (Stonedahl & Wilensky 2010) of Janssen’s (2009) NetLogo replication of the original Ascape model (Dean et al. 2000; Axtell et al. 2002). It contains four configurations in one NetLogo 7.0.4 file, selected with two switches:
- Both switches off: the baseline, which is the Models Library model with small fixes that make it work as intended (the arable-uplands zone name, the setup base yield, the initial household count, one-tick-lag capacity reporting, and seed control with observation-only instruments).
soil-on?: dynamic soil quality that depletes under cultivation and regrows, following Janssen (2010, eq. 4).
…
Anthill: A harvester ant colony built from the published science
Adrian Diez Cuadrado | Published Thursday, September 17, 2026 | Last modified Thursday, September 24, 2026An agent-based model of one colony of the Florida harvester ant, Pogonomyrmex badius, from the day a mated queen lands to the death of the colony. It runs in a web browser and, unchanged, headless in Node for replicate studies.
What the ants do: a claustral queen digs her own shaft and raises the first workers on her reserves; workers dig the nest under local rules, with no ant holding a plan; a one-way, age-based division of labour set by the season of birth, which no shortage reverses; trunk-trail foraging with site fidelity and recruitment; seed storage, opening and germination in the chambers, which is what feeds the larvae; daily weather from the climate normals of the study site, with drought years; nuptial flights after heavy rain; corpse removal; alarm at a disturbance on the foraging ground; and annual nest relocation, in which the store and then the brood are carried along the trail to a new nest the colony digs.
Every value in the model is tagged as measured in this species, borrowed from another ant, or invented, with its source, in a single parameter file. The model is deterministic: one seeded stream per system and a fixed one-minute timestep, so a seed reproduces a run bit for bit in the browser and in Node, which a test pins. A study writes a methods report listing the invented values the results rest on and the acceptance tests the model fails.
…
Peer reviewed Collective Problem-Solving Capacity, Trust, and O-Ring Team Productivity
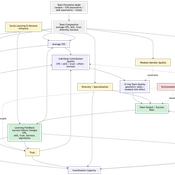
Taseer Salahuddin Hasan Vergil Muhammad Abdullah Yasser | Published Saturday, August 08, 2026This is a NetLogo 7.0.1 agent-based model of interdependent team productivity under O-ring production logic. The model asks when collective problem-solving capacity (CPS) improves team output and when its effect is constrained by trust, burnout, specialization diversity, weak-link quality, and team-formation rules. Agents are heterogeneous in skill, CPS, trust, burnout, effort, learning rate, openness, specialization, adaptability, and aspiration. Each tick forms temporary teams, computes individual contribution quality, combines contributions through a geometric O-ring production function with an explicit weakest-link term, records output and success, and updates agents through feedback, learning, trust change, burnout, recovery, and turnover. The paper follows the ODD protocol, reports exact implementation equations, and analyzes six BehaviorSpace experiments with 50 stochastic repetitions per condition. Scenario results show that CPS is beneficial but not sufficient: productivity is highest when CPS is combined with trust, low burnout, effective coordination, and a reliable weakest-link floor. Diversity yields only modest gains at low CPS but larger gains when CPS is high. Formation-mode results are especially informative because mixed CPS-skill formation maximizes total output, whereas random formation has the highest binary success rate, showing that output magnitude and threshold success can diverge. The study contributes a transparent computational mechanism linking collective intelligence with O-ring production and identifies boundary conditions under which high-CPS teams can still be limited by weak links and interdependence.
ZIP-Level Housing Supply Elasticity and Crash Dynamics: A GIS-Based Agent-Based Model of the Washington DC and Northern Virginia Metro Region
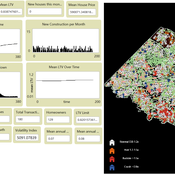
Mansoor Abdul Bari | Published Saturday, August 01, 2026 | Last modified Sunday, August 02, 2026This model tests whether local housing supply elasticity governs crash severity inside a single metropolitan housing market. Saiz (2010) established that across US metros, regions constrained by geography and regulation experience deeper boom-bust cycles than flexible ones. That finding is routinely applied downward to neighborhoods and ZIP codes as though the mechanism scaled without qualification.
The empirical record for the Washington DC and Northern Virginia region says it does not. Across 84 ZIP codes, measured supply elasticity ranges from 0.35 to 4.95 with a median of 1.21. The worst single-year price decline between 2007 and 2012 averaged 9.6 percent in constrained ZIP codes and 9.0 percent in flexible ones, a gap that cannot be distinguished from noise. Wide variation in the proposed cause, no meaningful separation in the proposed effect.
The model embeds households, houses and a metro-wide credit condition in the real ZIP geography of the region using three GIS layers and an empirical price panel. Local elasticity governs construction, exactly as theory predicts. Prices are driven by a shared macro drift schedule and, under the credit-amplified mode, by a leverage cycle with a financial accelerator and a deviation penalty. The design question is whether those shared forces are sufficient to override local supply differences at the sub-metropolitan scale.
…
Peer reviewed MOSAIC: Mission-Oriented Self-Organization through Auctions, Incentives, and Coalitions
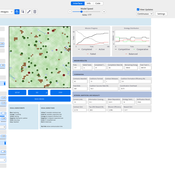
Katherin Molina Lorena Holguin | Published Friday, July 31, 2026 | Last modified Thursday, August 20, 2026MOSAIC is an agent-based NetLogo model of decentralized mission coordination among heterogeneous robots operating under partial observability, limited energy, spatially variable risk, dynamic communication, and individual and cooperative task requirements. Robots discover tasks locally, exchange task information through temporary communication links, submit capability-, energy-, deadline-, and risk-aware bids, compete for individual contracts, and form temporary coalitions for cooperative tasks.
The model integrates decentralized auctions, greedy capability-based coalition formation, contract release and reassignment, four reward regimes, reputation, adaptive bidding strategies, failure traceability, and mission-, network-, information-, inequality-, and coalition-level metrics. It operates without a centralized mission planner or global combinatorial assignment solver.
Seven paired-seed BehaviorSpace experiments comprising 690 official simulation runs evaluate baseline mission viability, reward regimes, communication structure, capability heterogeneity, cooperative-task demand, reputation and adaptive strategies, and mission-incentive strength. The results indicate that structural coordination capacity—particularly information reach, capability compatibility, and feasible coalition construction—has a stronger effect on mission completion than increasing incentive intensity within the tested architecture and parameter ranges.
…
Amber Dilemma Zone: Driver Cognition and Signal Control in Urban Traffic
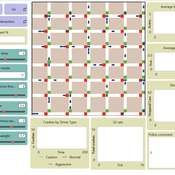
Mansoor Abdul Bari | Published Sunday, July 19, 2026This model is an extension of Wilensky’s (2003) Traffic Grid, a foundational NetLogo model of urban traffic flow. It embeds a dual-process cognitive architecture into each driver agent, transforming the original’s identical reactive units into cognitively heterogeneous individuals whose internal mental state evolves with experience; making the same intersection produce different decisions from different drivers, and different decisions from the same driver across occasions.
The core question the model addresses is the yellow-light dilemma zone: the seconds following amber onset in which a driver can neither stop safely nor clear the intersection before red. Field research documents that behavioral variance at this moment cannot be explained by geometry or legal obligation alone. This model provides the cognitive architecture that has been missing from traffic ABMs.
Each driver routes every amber-onset decision through either System 1 (fast, heuristic, automatic) or System 2 (slow, deliberative, prospect-theoretic), switching dynamically based on cognitive load, accumulated near-miss memory, and situational framing. The result is crash outcomes that are attributable, path-dependent, and sensitive to both driver disposition and signal infrastructure; none of which fixed-rule models can reproduce. Three signal control modes are included: fixed-cycle (replicating Wilensky’s original), adaptive-queue, and smart occupancy-based switching.
Peer reviewed Kenya ITN Agent-Based Microsimulation (2003–2024)
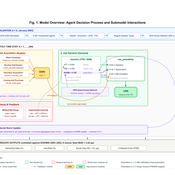
Wooyoung Kim Hosang Shin | Published Saturday, April 18, 2026 | Last modified Tuesday, June 16, 2026An agent-based microsimulation of insecticide-treated net (ITN) distribution and adoption in Kenya (2003–2024), integrating the Theory of Planned Behaviour, Rogers diffusion, Weibull net decay, and a GPS-based two-layer social network. 8,561 household agents calibrated via Approximate Bayesian Computation to six DHS/MIS survey waves, achieving 2.42 pp mean absolute error on Kenya-level ownership. The analysis chain supports mechanism counterfactuals and policy experiments on equity outcomes of ITN distribution strategies.
Displaying 10 of 111 results R clear search