About the CoMSES Model Library more info
Our mission is to help computational modelers develop, document, and share their computational models in accordance with community standards and good open science and software engineering practices. Model authors can publish their model source code in the Computational Model Library with narrative documentation as well as metadata that supports open science and emerging norms that facilitate software citation, computational reproducibility / frictionless reuse, and interoperability. Model authors can also request private peer review of their computational models. Models that pass peer review receive a DOI once published.
All users of models published in the library must cite model authors when they use and benefit from their code.
Please check out our model publishing tutorial and feel free to contact us if you have any questions or concerns about publishing your model(s) in the Computational Model Library.
We also maintain a curated database of over 7500 publications of agent-based and individual based models with detailed metadata on availability of code and bibliometric information on the landscape of ABM/IBM publications that we welcome you to explore.
Displaying 10 of 184 results for "J%C3%BCrgen%20Scheffran" clear search
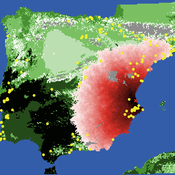
Neolithic Spread Model Version 1.0
Sean Bergin Salvador Pardo Gordo Joan Bernabeu Auban Michael Barton | Published Thursday, December 11, 2014 | Last modified Monday, December 31, 2018This model simulates different spread hypotheses proposed for the introduction of agriculture on the Iberian peninsula. We include three dispersal types: neighborhood, leapfrog, and ideal despotic distribution (IDD).
A simple behavioral model predicts the emergence of complex animal hierarchies
Takao Sasaki Zachary Joseph Shaffer Stephen Pratt Clint A Penick Jürgen Liebig | Published Tuesday, December 22, 2015We used our model to test how different combinations of dominance interactions present in H. saltator could result in linear, despotic, or shared hierarchies.
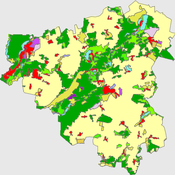
Peer reviewed The Viability of the Social-Ecological Agroecosystem (ViSA) Spatial Agent-based Model
Mostafa Shaaban | Published Friday, June 03, 2022ViSA simulates the decision behaviors of different stakeholders showing demands for ecosystem services (ESS) in agricultural landscape. The lack of sufficient supply of ESSs triggers stakeholders to apply different management options to increase their supply. However, while attempting to reduce the supply-demand gap, conflicts arise among stakeholders due to the tradeoff nature of some ESS. ViSA investigates conditions and scenarios that can minimize such supply-demand gap while reducing the risk of conflicts by suggesting different mixes of management options and decision rules.
BEEHAVE Extension: Varroa mite control within Good Beekeeping Practice in Germany
Volker Grimm Jürgen Groeneveld Isabel Schödl | Published Wednesday, May 25, 2022 | Last modified Monday, November 07, 2022The western honey bee Apis mellifera is the most important pollinator in the world. The biggest threat to managed honey bees is the ectoparasitic mite Varroa destructor and the viruses DWV (Deformed Wing Virus) and APV (Acute Paralysis Virus) it transmits. Untreated honey bee colonies are expected to die within one to three years. This led to the development of strategies for beekeepers to control the Varroa mite in honey bee colonies and ensure the health and survival of their bee colonies, so called Good Beekeeping Practice. The aim of the extension of BEEHAVE was to represent the Good Beekeeping Practice of Varroa control in Germany. The relevant measures within the Varroa control strategies are drone brood removal as a Varroa trap and the treatment of bee colonies with organic acaricides (formic and oxalic acid) to kill the mites. This extension improves BEEHAVE and builds a bridge between beekeepers in practice and in the modelling world. It vastly contributes to the future use of BEEHAVE in beekeeping education in Germany.
Peer reviewed Correlated Random Walk (NetLogo)
Viktoriia Radchuk Uta Berger Thibault Fronville | Published Tuesday, May 09, 2023 | Last modified Monday, December 18, 2023This is NetLogo code that presents two alternative implementations of Correlated Random Walk (CRW):
- 1. drawing the turning angles from the uniform distribution, i.e. drawing the angle with the same probability from a certain given range;
- 2. drawing the turning angles from von Mises distribution.
The move lengths are drawn from the lognormal distribution with the specified parameters.
Correlated Random Walk is used to represent the movement of animal individuals in two-dimensional space. When modeled as CRW, the direction of movement at any time step is correlated with the direction of movement at the previous time step. Although originally used to describe the movement of insects, CRW was later shown to sufficiently well describe the empirical movement data of other animals, such as wild boars, caribous, sea stars.
…
Correlated random walk (Javascript)
Viktoriia Radchuk Uta Berger Thibault Fronville | Published Tuesday, May 09, 2023The first simple movement models used unbiased and uncorrelated random walks (RW). In such models of movement, the direction of the movement is totally independent of the previous movement direction. In other words, at each time step the direction, in which an individual is moving is completely random. This process is referred to as a Brownian motion.
On the other hand, in correlated random walks (CRW) the choice of the movement directions depends on the direction of the previous movement. At each time step, the movement direction has a tendency to point in the same direction as the previous one. This movement model fits well observational movement data for many animal species.
The presented agent based model simulated the movement of the agents as a correlated random walk (CRW). The turning angle at each time step follows the Von Mises distribution with a ϰ of 10. The closer ϰ gets to zero, the closer the Von Mises distribution becomes uniform. The larger ϰ gets, the more the Von Mises distribution approaches a normal distribution concentrated around the mean (0°).
In this script the turning angles (following the Von Mises distribution) are generated based on the the instructions from N. I. Fisher 2011.
This model is implemented in Javascript and can be used as a building block for more complex agent based models that would rely on describing the movement of individuals with CRW.
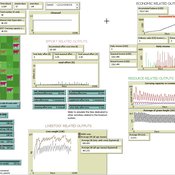
Peer reviewed soslivestock model
Marco Janssen Irene Perez Ibarra Diego J. Soler-Navarro Alicia Tenza Peral | Published Wednesday, May 28, 2025 | Last modified Tuesday, June 10, 2025The purpose of this model is to analyze how different management strategies affect the wellbeing, sustainability and resilience of an extensive livestock system under scenarios of climate change and landscape configurations. For this purpose, it simulates one cattle farming system, in which agents (cattle) move through the space using resources (grass). Three farmer profiles are considered: 1) a subsistence farmer that emphasizes self-sufficiency and low costs with limited attention to herd management practices, 2) a commercial farmer focused on profit maximization through efficient production methods, and 3) an environmental farmer that prioritizes conservation of natural resources and animal welfare over profit maximization. These three farmer profiles share the same management strategies to adapt to climate and resource conditions, but differ in their goals and decision-making criteria for when, how, and whether to implement those strategies. This model is based on the SequiaBasalto model (Dieguez Cameroni et al. 2012, 2014, Bommel et al. 2014 and Morales et al. 2015), replicated in NetLogo by Soler-Navarro et al. (2023).
One year is 368 days. Seasons change every 92 days. Each step begins with the growth of grass as a function of climate and season. This is followed by updating the live weight of animals according to the grass height of their patch, and grass consumption, which is determined based on the updated live weight. Animals can be supplemented by the farmer in case of severe drought. After consumption, cows grow and reproduce, and a new grass height is calculated. This updated grass height value becomes the starting grass height for the next day. Cows then move to the next area with the highest grass height. After that, cattle prices are updated and cattle sales are held on the first day of fall. In the event of a severe drought, special sales are held. Finally, at the end of the day, the farm balance and the farmer’s effort are calculated.
MERCURY extension: population
Tom Brughmans | Published Thursday, May 23, 2019This model is an extended version of the original MERCURY model (https://www.comses.net/codebases/4347/releases/1.1.0/ ) . It allows for experiments to be performed in which empirically informed population sizes of sites are included, that allow for the scaling of the number of tableware traders with the population of settlements, and for hypothesised production centres of four tablewares to be used in experiments.
Experiments performed with this population extension and substantive interpretations derived from them are published in:
Hanson, J.W. & T. Brughmans. In press. Settlement scale and economic networks in the Roman Empire, in T. Brughmans & A.I. Wilson (ed.) Simulating Roman Economies. Theories, Methods and Computational Models. Oxford: Oxford University Press.
…
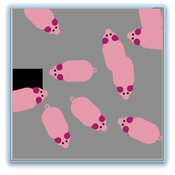
Tail biting behaviour in pigs
Iris J.M.M. Boumans Iris Jmm Boumans | Published Friday, April 22, 2016 | Last modified Wednesday, September 14, 2016The model simulates tail biting behaviour in pigs and how they can turn into a biter and/or victim. The effect of a redirected motivation, behavioural changes in victims and preference to bite a lying pig on tail biting can be tested in the model
Peer reviewed The Viability of the Social-Ecological Agroecosystem (ViSA) Spatial Agent-based Model
Mostafa Shaaban | Published Monday, March 25, 2024ViSA 2.0.0 is an updated version of ViSA 1.0.0 aiming at integrating empirical data of a new use case that is much smaller than in the first version to include field scale analysis. Further, the code of the model is simplified to make the model easier and faster. Some features from the previous version have been removed.
It simulates decision behaviors of different stakeholders showing demands for ecosystem services (ESS) in agricultural landscape. It investigates conditions and scenarios that can increase the supply of ecosystem services while keeping the viability of the social system by suggesting different mixes of initial unit utilities and decision rules.
Displaying 10 of 184 results for "J%C3%BCrgen%20Scheffran" clear search