Our mission is to help computational modelers develop, document, and share their computational models in accordance with community standards and good open science and software engineering practices. Model authors can publish their model source code in the Computational Model Library with narrative documentation as well as metadata that supports open science and emerging norms that facilitate software citation, computational reproducibility / frictionless reuse, and interoperability. Model authors can also request private peer review of their computational models. Models that pass peer review receive a DOI once published.
All users of models published in the library must cite model authors when they use and benefit from their code.
Please check out our model publishing tutorial and feel free to contact us if you have any questions or concerns about publishing your model(s) in the Computational Model Library.
Displaying 10 of 1051 results for "J Van Der Beek" clear search
Social and Task Interdependencies in Innovation Implementation
Spiro Maroulis Uri Wilensky | Published Tuesday, June 04, 2013 | Last modified Tuesday, March 04, 2014This is a model of innovation implementation inside an organization. It characterizes an innovation as a set of distributed and technically interdependent tasks performed by a number of different and socially interconnected frontline workers.
Team Cognition
Iris Lorscheid | Published Sunday, May 23, 2021The teamCognition model investigates team decision processes by using an agent-based model to conceptualize team decisions as an emergent property. It uses a mixed-method research design with a laboratory experiment providing qualitative and quantitative input for the model’s construction, as well as data for an output validation of the model. The agent-based model is used as a computational testbed to contrast several processes of team decision making, representing potential, simplified mechanisms of how a team decision emerges. The increasing overall fit of the simulation and empirical results indicates that the modeled decision processes can at least partly explain the observed team decisions.
Tram Commute
Julia Kasmire | Published Thursday, February 13, 2020 | Last modified Monday, March 02, 2020A demonstration model showing how modellers can create a multi regional tram network with commuters, destinations and houses. The model offers options to create a random tram network made from modeller input or to load shapefiles for the Greater Manchester Metrolink.
The model uses NetLogo with gis, nw an csv extensions.
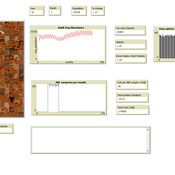
Peer reviewed DogPopDy: ABM for ABC planning
Aniruddha Belsare Abi Vanak | Published Saturday, August 01, 2020An agent-based model designed as a tool to assess and plan free-ranging dog population management programs that implement Animal Birth Control (ABC). The time, effort, financial resources and conditions needed to successfully control dog populations and achieve rabies control can be determined by performing virtual experiments using DogPopDy.
FLOSSSim: An Agent-Based Model of the Free/Libre Open Source Software (FLOSS) Development Process
Nicholas Radtke | Published Saturday, December 31, 2011 | Last modified Saturday, April 27, 2013An agent-based model of the Free/Libre Open Source Software (FLOSS) development process designed around agents selecting FLOSS projects to contribute to and/or download.
Group assortment with preference rankings
Fredrik Jansson | Published Thursday, July 14, 2016 | Last modified Monday, April 09, 2018This model uses preference rankings w.r.t. ethnic group compositions (e.g. at companies) and assigns ethnic agents to groups based on their rankings.
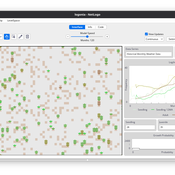
Logônia: Plant Growth Response Model in NetLogo
Daniel Vartanian Leandro Garcia Aline | Published Saturday, September 13, 2025 | Last modified Monday, July 13, 2026Logônia is a NetLogo model that simulates the growth response of a fictional plant, Logônia, under different climatic conditions. The model uses climate data from WorldClim 2.1 (Fick & Hijmans, 2017) and demonstrates how to integrate the LogoClim model through the LevelSpace extension.
The model was developed according to the FAIR principles for research software (Barker et al., 2022) and is openly available on the CoMSES Network and GitHub.

How to not get stuck – an ant model showing how negative feedback due to crowding maintains flexibility in ant foraging
Tomer Czaczkes | Published Thursday, December 17, 2015Positive feedback can lead to “trapping” in local optima. Adding a simple negative feedback effect, based on ant behaviour, prevents this trapping
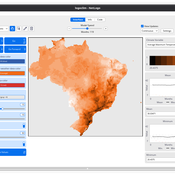
LogoClim: WorldClim in NetLogo
Daniel Vartanian Leandro Garcia Aline Aline Martins de Carvalho | Published Thursday, July 03, 2025 | Last modified Monday, July 13, 2026LogoClim is a NetLogo model designed to be integrated into other simulations through the LevelSpace extension (Hjorth et al., 2020), providing high resolution climate data from sources validated and used by the Intergovernmental Panel on Climate Change (IPCC).
The model simplifies and standardizes the integration of climate data into NetLogo, allowing researchers to focus their efforts on the model itself with the assurance of using reliable and widely recognized data. Although its main use is as a component of larger simulations, LogoClim also has its own graphical interface for monitoring and checking the datasets.
The climate data comes from the WorldClim 2.1 project (Fick & Hijmans, 2017), for which LogoClim works as an interface to NetLogo. The model supports all three WorldClim data series: (1) Historical Climate Data (1970 to 2000), with 12 monthly points for minimum, mean, and maximum temperature, precipitation, solar radiation, wind speed, vapor pressure, elevation, and bioclimatic variables; (2) Historical Monthly Weather Data (1951 to 2024), based on downscaling of CRU-TS-4.09, developed by the Climatic Research Unit at the University of East Anglia (Harris et al., 2020), with minimum and maximum temperature and total precipitation; and (3) Future Climate Data, based on downscaling climate projections derived from global climate models of the Coupled Model Intercomparison Project Phase 6 (CMIP6) (Eyring et al., 2016) for four future periods (2021 to 2040, 2041 to 2060, 2061 to 2080, and 2081 to 2100) and four scenarios based on the Shared Socioeconomic Pathways (SSPs 126, 245, 370, and 585), covering minimum and maximum temperature, total precipitation, and bioclimatic variables. All series are available at multiple spatial resolutions, from 10 minutes (about 340 km² at the equator) to 30 seconds (about 1 km² at the equator).
…
An agent-based model to study the effects of urban sprawl on bird distribution
Yun Ouyang | Published Tuesday, December 16, 2008 | Last modified Saturday, April 27, 2013This model was programmed for a class project, which studied the effects of urban sprawl on bird distribution. For the urban sprawl part of the model, we started from the model in (udhira, H. S., 200
Displaying 10 of 1051 results for "J Van Der Beek" clear search