Our mission is to help computational modelers develop, document, and share their computational models in accordance with community standards and good open science and software engineering practices. Model authors can publish their model source code in the Computational Model Library with narrative documentation as well as metadata that supports open science and emerging norms that facilitate software citation, computational reproducibility / frictionless reuse, and interoperability. Model authors can also request private peer review of their computational models. Models that pass peer review receive a DOI once published.
All users of models published in the library must cite model authors when they use and benefit from their code.
Please check out our model publishing tutorial and feel free to contact us if you have any questions or concerns about publishing your model(s) in the Computational Model Library.
Displaying 10 of 223 results for "Marc Choisy" clear search
Demography, Industry and Residential Choice (DIReC) model
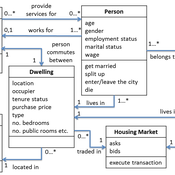
Jiaqi Ge | Published Wednesday, September 04, 2019The integrated and spatially-explicit ABM, called DIReC (Demography, Industry and Residential Choice), has been developed for Aberdeen City and the surrounding Aberdeenshire (Ge, Polhill, Craig, & Liu, 2018). The model includes demographic (individual and household) models, housing infrastructure and occupancy, neighbourhood quality and evolution, employment and labour market, business relocation, industrial structure, income distribution and macroeconomic indicators. DIReC includes a detailed spatial housing model, basing preference models on house attributes and multi-dimensional neighbourhood qualities (education, crime, employment etc.).
The dynamic ABM simulates the interactions between individuals, households, the labour market, businesses and services, neighbourhoods and economic structures. It is empirically grounded using multiple data sources, such as income and gender-age distribution across industries, neighbourhood attributes, business locations, and housing transactions. It has been used to study the impact of economic shocks and structural changes, such as the crash of oil price in 2014 (the Aberdeen economy heavily relies on the gas and oil sector) and the city’s transition from resource-based to a green economy (Ge, Polhill, Craig, & Liu, 2018).
Shellmound Mobility
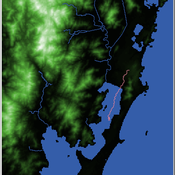
Henrique de Sena Kozlowski | Published Saturday, June 15, 2024Least Cost Path (LCP) analysis is a recurrent theme in spatial archaeology. Based on a cost of movement image, the user can interpret how difficult it is to travel around in a landscape. This kind of analysis frequently uses GIS tools to assess different landscapes. This model incorporates some aspects of the LCP analysis based on GIS with the capabilities of agent-based modeling, such as the possibility to simulate random behavior when moving. In this model the agent will travel around the coastal landscape of Southern Brazil, assessing its path based on the different cost of travel through the patches. The agents represent shellmound builders (sambaquieiros), who will travel mainly through the use of canoes around the lagoons.
How it works?
When the simulation starts the hiker agent moves around the world, a representation of the lagoon landscape of the Santa Catarina state in Southern Brazil. The agent movement is based on the travel cost of each patch. This travel cost is taken from a cost surface raster created in ArcMap to represent the different cost of movement around the landscape. Each tick the agent will have a chance to select the best possible patch to move in its Field of View (FOV) that will take it towards its target destination. If it doesn’t select the best possible patch, it will randomly choose one of the patches to move in its FOV. The simulation stops when the hiker agent reaches the target destination. The elevation raster file and the cost surface map are based on a 1 Arc-second (30m) resolution SRTM image, scaled down 5 times. Each patch represents a square of 150m, with an area of 0,0225km². The dataset uses a UTM Sirgas 2000 22S projection system. There are four different cost functions available to use. They change the cost surface used by the hikers to navigate around the world.
Direct versus Connect
Steven Kimbrough | Published Sunday, January 15, 2023This NetLogo model is an implementation of the mostly verbal (and graphic) model in Jarret Walker’s Human Transit: How Clearer Thinking about Public Transit Can Enrich Our Communities and Our Lives (2011). Walker’s discussion is in the chapter “Connections or Complexity?”. See especially figure 12-2, which is on page 151.
In “Connections or Complexity?”, Walker frames the matter as involving a choice between two conflicting goals. The first goal is to minimize connections, the need to make transfers, in a transit system. People naturally prefer direct routes. The second goal is to minimize complexity. Why? Well, read the chapter, but as a general proposition we want to avoid unnecessary complexity with its attendant operating characteristics (confusing route plans in the case of transit) and management and maintenance challenges. With complexity general comes degraded robustness and resilience.
How do we, how can we, choose between these conflicting goals? The grand suggestion here is that we only choose indirectly, implicitly. In the present example of connections versus complexity we model various alternatives and compare them on measures of performance (MoP) other than complexity or connections per se. The suggestion is that connections and complexity are indicators of, heuristics for, other MoPs that are more fundamental, such as cost, robustness, energy use, etc., and it is these that we at bottom care most about. (Alternatively, and not inconsistently, we can view connections and complexity as two of many MoPs, with the larger issue to be resolve in light of many MoPs, including but not limited to complexity and connections.) We employ modeling to get a handle on these MoPs. Typically, there will be several, taking us thus to a multiple criteria decision making (MCDM) situation. That’s the big picture.
A simulation model for Dublin city
umesh7lowe | Published Friday, April 10, 2026An agent-based model of urban travel behaviour in Dublin, Ireland, built in NetLogo and empirically grounded in 2016 travel survey data. Each agent represents a Dublin resident initialised with real socio-demographic attributes — including age, gender, household size and car ownership, income, driving licence status, and access to local amenities — alongside observed trip characteristics such as distance, travel time, and trip type (work, shopping, leisure).
At each time step, agents choose between four transport modes (car, public transport, cycling, and walking) across short, medium, and long trips. Mode choice is governed by a preference vector that weighs personal need satisfaction against social influence from neighbouring agents reflecting consumat framework. Satisfaction evolves dynamically based on cost (incorporating Irish motor tax bands and per-km operating rates), travel time, and trip-type suitability, with an uncertainty parameter capturing variability in perceived utility over time.
The model tracks aggregate modal shares and total CO2 emission at each tick, enabling exploration of how policy interventions — such as fuel taxation, public transport pricing, or active travel incentives — might shift the city’s travel demand profile over 100 simulated days.
Peer reviewed Garbage can model Excel reconstruction
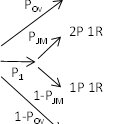
Smarzhevskiy Ivan | Published Tuesday, August 19, 2014 | Last modified Tuesday, July 30, 2019Reconstruction of the original code M. Cohen, J. March, and J. Olsen garbage can model, realized by means of Microsoft Office Excel 2010
Patch choice model from Optimal Foraging Theory (Human Behavioral Ecology)
C Michael Barton | Published Saturday, November 22, 2008 | Last modified Saturday, April 27, 2013NetLogo model of patch choice model from optimal foraging theory (human behavioral ecology).
Growing Unpopular Norms. A Network-Situated ABM of Norm Choice.
C Merdes | Published Tuesday, November 22, 2016 | Last modified Saturday, March 17, 2018The model’s purpose is to provide a potential explanation for the emergence, sustenance and decline of unpopular norms based on pluralistic ignorance on a social network.
Dynamics of Public Opinion with Diverse Media and Audiences' Choice
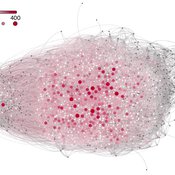
Zhongtian Chen | Published Sunday, April 25, 2021Studies on the fundamental role of diverse media in the evolution of public opinion can protect us from the spreading brainwashing, extremism, and terrorism. Many fear the information cocoon may result in polarization of the public opinion. The model of opinion dynamics that considers different influences and horizons for every individual, and the simulations are based on a real-world social network.

Artificial Anasazi: Baseline Fixes, Dynamic Soil and Plot Crowding
Thomas Tuoti | Published Sunday, October 04, 2026Artificial Anasazi is an agent-based model of farming households in the Long House Valley, Arizona, from 800 to 1350 CE. Each household chooses where to farm and settle based on expected harvest, water sources and stored maize, and simulated household counts are compared with the archaeological record.
This release adapts the NetLogo Models Library version (Stonedahl & Wilensky 2010) of Janssen’s (2009) NetLogo replication of the original Ascape model (Dean et al. 2000; Axtell et al. 2002). It contains four configurations in one NetLogo 7.0.4 file, selected with two switches:
- Both switches off: the baseline, which is the Models Library model with small fixes that make it work as intended (the arable-uplands zone name, the setup base yield, the initial household count, one-tick-lag capacity reporting, and seed control with observation-only instruments).
soil-on?: dynamic soil quality that depletes under cultivation and regrows, following Janssen (2010, eq. 4).
…
A model of urban expansion policy scenarios using an agent-based approach—a case of the Guangzhou Metropolitan Region of China
Guangjin Tian | Published Friday, March 21, 2014Three policy scenarios for urban expansion under the influences of the behaviours and decision modes of four agents and their interactions have been applied to predict the future development patterns of the Guangzhou metropolitan region.
Displaying 10 of 223 results for "Marc Choisy" clear search