Our mission is to help computational modelers develop, document, and share their computational models in accordance with community standards and good open science and software engineering practices. Model authors can publish their model source code in the Computational Model Library with narrative documentation as well as metadata that supports open science and emerging norms that facilitate software citation, computational reproducibility / frictionless reuse, and interoperability. Model authors can also request private peer review of their computational models. Models that pass peer review receive a DOI once published.
All users of models published in the library must cite model authors when they use and benefit from their code.
Please check out our model publishing tutorial and feel free to contact us if you have any questions or concerns about publishing your model(s) in the Computational Model Library.
Displaying 10 of 368 results for "Emmanuel Mhike Hove" clear search
Introducing two extensions of Schelling's segregation model
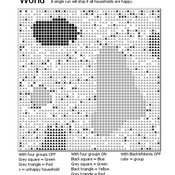
Andreas Flache Carlos A. de Matos Fernandes | Published Monday, January 25, 2021Schelling famously proposed an extremely simple but highly illustrative social mechanism to understand how strong ethnic segregation could arise in a world where individuals do not necessarily want it. Schelling’s simple computational model is the starting point for our extensions in which we build upon Wilensky’s original NetLogo implementation of this model. Our two NetLogo models can be best studied while reading our chapter “Agent-based Computational Models” (Flache and de Matos Fernandes, 2021). In the chapter, we propose 10 best practices to elucidate how agent-based models are a unique method for providing and analyzing formally precise, and empirically plausible mechanistic explanations of puzzling social phenomena, such as segregation, in the social world. Our chapter addresses in particular analytical sociologists who are new to ABMs.
In the first model (SegregationExtended), we build on Wilensky’s implementation of Schelling’s model which is available in NetLogo library (Wilensky, 1997). We considerably extend this model, allowing in particular to include larger neighborhoods and a population with four groups roughly resembling the ethnic composition of a contemporary large U.S. city. Further features added concern the possibility to include random noise, and the addition of a number of new outcome measures tuned to highlight macro-level implications of the segregation dynamics for different groups in the agent society.
In SegregationDiscreteChoice, we further modify the model incorporating in particular three new features: 1) heterogeneous preferences roughly based on empirical research categorizing agents into low, medium, and highly tolerant within each of the ethnic subgroups of the population, 2) we drop global thresholds (%-similar-wanted) and introduce instead a continuous individual-level single-peaked preference function for agents’ ideal neighborhood composition, and 3) we use a discrete choice model according to which agents probabilistically decide whether to move to a vacant spot or stay in the current spot by comparing the attractiveness of both locations based on the individual preference functions.
…
An agent-based model to simulate field-specific nitrogen fertilizer applications in grasslands
Maria Haensel Thomas Schmitt Andrea Kaim Sylvia Helena Annuth Thomas Koellner | Published Sunday, February 09, 2025Grasslands have a large share of the world’s land cover and their sustainable management is important for the protection and provisioning of grassland ecosystem services. The question of how to manage grassland sustainably is becoming increasingly important, especially in view of climate change, which on the one hand extends the vegetation period (and thus potentially allows use intensification) and on the other hand causes yield losses due to droughts. Fertilization plays an important role in grassland management and decisions are usually made at farm level. Data on fertilizer application rates are crucial for an accurate assessment of the effects of grassland management on ecosystem services. However, these are generally not available on farm/field scale. To close this gap, we present an agent-based model for Fertilization In Grasslands (FertIG). Based on animal, land-use, and cutting data, the model estimates grassland yields and calculates field-specific amounts of applied organic and mineral nitrogen on grassland (and partly cropland). Furthermore, the model considers different legal requirements (including fertilization ordinances) and nutrient trade among farms. FertIG was applied to a grassland-dominated region in Bavaria, Germany comparing the effects of changes in the fertilization ordinance as well as nutrient trade. The results show that the consideration of nutrient trade improves organic fertilizer distribution and leads to slightly lower Nmin applications. On a regional scale, recent legal changes (fertilization ordinance) had limited impacts. Limiting the maximum applicable amount of Norg to 170 kg N/ha fertilized area instead of farm area as of 2020 hardly changed fertilizer application rates. No longer considering application losses in the calculation of fertilizer requirements had the strongest effects, leading to lower supplementary Nmin applications. The model can be applied to other regions in Germany and, with respective adjustments, in Europe. Generally, it allows comparing the effects of policy changes on fertilization management at regional, farm and field scale.
Peer reviewed AgModel
Isaac Ullah | Published Friday, December 06, 2024AgModel is an agent-based model of the forager-farmer transition. The model consists of a single software agent that, conceptually, can be thought of as a single hunter-gather community (i.e., a co-residential group that shares in subsistence activities and decision making). The agent has several characteristics, including a population of human foragers, intrinsic birth and death rates, an annual total energy need, and an available amount of foraging labor. The model assumes a central-place foraging strategy in a fixed territory for a two-resource economy: cereal grains and prey animals. The territory has a fixed number of patches, and a starting number of prey. While the model is not spatially explicit, it does assume some spatiality of resources by including search times.
Demographic and environmental components of the simulation occur and are updated at an annual temporal resolution, but foraging decisions are “event” based so that many such decisions will be made in each year. Thus, each new year, the foraging agent must undertake a series of optimal foraging decisions based on its current knowledge of the availability of cereals and prey animals. Other resources are not accounted for in the model directly, but can be assumed for by adjusting the total number of required annual energy intake that the foraging agent uses to calculate its cereal and prey animal foraging decisions. The agent proceeds to balance the net benefits of the chance of finding, processing, and consuming a prey animal, versus that of finding a cereal patch, and processing and consuming that cereal. These decisions continue until the annual kcal target is reached (balanced on the current human population). If the agent consumes all available resources in a given year, it may “starve”. Starvation will affect birth and death rates, as will foraging success, and so the population will increase or decrease according to a probabilistic function (perturbed by some stochasticity) and the agent’s foraging success or failure. The agent is also constrained by labor caps, set by the modeler at model initialization. If the agent expends its yearly budget of person-hours for hunting or foraging, then the agent can no longer do those activities that year, and it may starve.
Foragers choose to either expend their annual labor budget either hunting prey animals or harvesting cereal patches. If the agent chooses to harvest prey animals, they will expend energy searching for and processing prey animals. prey animals search times are density dependent, and the number of prey animals per encounter and handling times can be altered in the model parameterization (e.g. to increase the payoff per encounter). Prey animal populations are also subject to intrinsic birth and death rates with the addition of additional deaths caused by human predation. A small amount of prey animals may “migrate” into the territory each year. This prevents prey animals populations from complete decimation, but also may be used to model increased distances of logistic mobility (or, perhaps, even residential mobility within a larger territory).
…
The Effect of Different Governmental Pandemic Control Measures on the Spread of a Virus Disease
Chiara Letter | Published Wednesday, January 26, 2022In this model, the spread of a virus disease in a network consisting of school pupils, employed, and umemployed people is simulated. The special feature in this model is the distinction between different types of links: family-, friends-, school-, or work-links. In this way, different governmental measures can be implemented in order to decelerate or stop the transmission.
A Bottom-Up Simulation on Competition and Displacement of Online Interpersonal Communication Platforms
great-sage-futao | Published Tuesday, December 31, 2019 | Last modified Tuesday, December 31, 2019This model aims to simulate Competition and Displacement of Online Interpersonal Communication Platforms process from a bottom-up angle. Individual interpersonal communication platform adoption and abandonment serve as the micro-foundation of the simulation model. The evolution mode of platform user online communication network determines how present platform users adjust their communication relationships as well as how new users join that network. This evolution mode together with innovations proposed by individual interpersonal communication platforms would also have impacts on the platform competition and displacement process and result by influencing individual platform adoption and abandonment behaviors. Three scenes were designed to simulate some common competition situations occurred in the past and current time, that two homogeneous interpersonal communication platforms competed with each other when this kind of platforms first came into the public eye, that a late entrant platform with a major innovation competed with the leading incumbent platform during the following days, as well as that both the leading incumbent and the late entrant continued to propose many small innovations to compete in recent days, respectively.
Initial parameters are as follows: n(Nmax in the paper), denotes the final node number of the online communication network node. mi (m in the paper), denotes the initial degree of those initial network nodes and new added nodes. pc(Pc in the paper), denotes the proportion of links to be removed and added in each epoch. pst(Pv in the paper), denotes the proportion of nodes with a viscosity to some platforms. comeintime(Ti in the paper), denotes the epoch when Platform 2 joins the market. pit(Pi in the paper), denotes the proportion of nodes adopting Platform 2 immediately at epoch comeintime(Ti). ct(Ct in the paper), denotes the Innovation Effective Period length. In Scene 2, There is only one major platform proposed by Platform 2, and ct describes that length. However, in Scene 3, Platform 2 and 1 will propose innovations alternately. And so, we set ct=10000 in simulation program, and every jtt epochs, we alter the innovation proposer from one platform to the other. Hence in this scene, jtt actually denotes the Innovation Effective Period length instead of ct.
Residents planned behaviour of waste sorting to explore urban situations
Jonathan Edgardo Cohen | Published Wednesday, June 07, 2023 | Last modified Thursday, March 14, 2024Municipal waste management (MWM) is essential for urban development. Efficient waste management is essential for providing a healthy and clean environment, for reducing GHGs and for increasing the amount of material recycled. Waste separation at source is perceived as an effective MWM strategy that relays on the behaviour of citizens to separate their waste in different fractions. The strategy is straightforward, and many cities have adopted the strategy or are working to implement it. However, the success of such strategy depends on adequate understanding of the drivers of the behaviour of proper waste sorting. The Theory of Planned Behaviour (TPB) has been extensively applied to explain the behaviour of waste sorting and contributes to determining the importance of different psychological constructs. Although, evidence shows its validity in different contexts, without exploring how urban policies and the built environment affect the TPB, its application to urban challenges remains unlocked. To date, limited research has focused in exposing how different urban situations such as: distance to waste bins, conditions of recycling facilities or information campaigns affect the planned behaviour of waste separation. To fill this gap, an agent-based model (ABM) of residents capable of planning the behaviour of waste separation is developed. The study is a proof of concept that shows how the TPB can be combined with simulations to provide useful insights to evaluate different urban planning situations. In this paper we depart from a survey to capture TPB constructs, then Structural Equation Modelling (SEM) is used to validate the TPB hypothesis and extract the drivers of the behaviour of waste sorting. Finally, the development of the ABM is detailed and the drivers of the TPB are used to determine how the residents behave. A low-density and a high-density urban scenario are used to extract policy insights. In conclusion, the integration between the TPB into ABMs can help to bridge the knowledge gap between can provide a useful insight to analysing and evaluating waste management scenarios in urban areas. By better understanding individual waste sorting behaviour, we can develop more effective policies and interventions to promote sustainable waste management practices.
Agent-Based Model of a Circular Food Packaging Ecosystem to assess Packaging Waste Dynamics
Annoek Reitsema | Published Friday, October 11, 2024Reducing packaging waste is a critical challenge that requires organizations to collaborate within circular ecosystems, considering social, economic, and technical variables like decision-making behavior, material prices, and available technologies. Agent-Based Modeling (ABM) offers a valuable methodology for understanding these complex dynamics. In our research, we have developed an ABM to explore circular ecosystems’ potential in reducing packaging waste, using a case study of the Dutch food packaging ecosystem. The model incorporates three types of agents—beverage producers, packaging producers, and waste treaters—who can form closed-loop recycling systems.
Beverage Producer Agents: These agents represent the beverage company divided into five types based on packaging formats: cans, PET bottles, glass bottles, cartons, and bag-in-boxes. Each producer has specific packaging demands based on product volume, type, weight, and reuse potential. They select packaging suppliers annually, guided by deterministic decision styles: bargaining (seeking the lowest price) or problem-solving (prioritizing high recycled content).
Packaging Producer Agents: These agents are responsible for creating packaging using either recycled or virgin materials. The model assumes a mix of monopolistic and competitive market situations, with agents calculating annual material needs. Decision styles influence their choices: bargaining agents compare recycled and virgin material costs, while problem-solving agents prioritize maximum recycled content. They calculate recycled content in packaging and set prices accordingly, ensuring all produced packaging is sold within or outside the model.
…
FilterBubbles_in_Carley1991
Benoît Desmarchelier | Published Wednesday, May 21, 2025The model is an extension of: Carley K. (1991) “A theory of group stability”, American Sociological Review, vol. 56, pp. 331-354.
The original model from Carley (1991) works as follows:
- Agents know or ignore a series of knowledge facts;
- At each time step, each agent i choose a partner j to interact with at random, with a probability of choice proportional to the degree of knowledge facts they have in common.
- Agents interact synchronously. As such, interaction happens only if the partnert j is not already busy interacting with someone else.
…
The uFUNK Model
Davide Secchi | Published Monday, August 31, 2020The agent-based simulation is set to work on information that is either (a) functional, (b) pseudo-functional, (c) dysfunctional, or (d) irrelevant. The idea is that a judgment on whether information falls into one of the four categories is based on the agent and its network. In other words, it is the agents who interprets a particular information as being (a), (b), (c), or (d). It is a decision based on an exchange with co-workers. This makes the judgment a socially-grounded cognitive exercise. The uFUNK 1.0.2 Model is set on an organization where agent-employee work on agent-tasks.
The Targeted Subsidies Plan Model
Hassan Bashiri | Published Thursday, September 21, 2023The targeted subsidies plan model is based on the economic concept of targeted subsidies.
The targeted subsidies plan model simulates the distribution of subsidies among households in a community over several years. The model assumes that the government allocates a fixed amount of money each year for the purpose of distributing cash subsidies to eligible households. The eligible households are identified by dividing families into 10 groups based on their income, property, and wealth. The subsidy is distributed to the first four groups, with the first group receiving the highest subsidy amount. The model simulates the impact of the subsidy distribution process on the income and property of households in the community over time.
The model simulates a community of 230 households, each with a household income and wealth that follows a power-law distribution. The number of household members is modeled by a normal distribution. The model allocates a fixed amount of money each year for the purpose of distributing cash subsidies among eligible households. The eligible households are identified by dividing families into 10 groups based on their income, property, and wealth. The subsidy is distributed to the first four groups, with the first group receiving the highest subsidy amount.
The model runs for a period of 10 years, with the subsidy distribution process occurring every month. The subsidy received by each household is assumed to be spent, and a small portion may be saved and added to the household’s property. At the end of each year, the grouping of households based on income and assets is redone, and a number of families may be moved from one group to another based on changes in their income and property.
…
Displaying 10 of 368 results for "Emmanuel Mhike Hove" clear search