About the CoMSES Model Library more info
Our mission is to help computational modelers develop, document, and share their computational models in accordance with community standards and good open science and software engineering practices. Model authors can publish their model source code in the Computational Model Library with narrative documentation as well as metadata that supports open science and emerging norms that facilitate software citation, computational reproducibility / frictionless reuse, and interoperability. Model authors can also request private peer review of their computational models. Models that pass peer review receive a DOI once published.
All users of models published in the library must cite model authors when they use and benefit from their code.
Please check out our model publishing tutorial and feel free to contact us if you have any questions or concerns about publishing your model(s) in the Computational Model Library.
We also maintain a curated database of over 7500 publications of agent-based and individual based models with detailed metadata on availability of code and bibliometric information on the landscape of ABM/IBM publications that we welcome you to explore.
Displaying 10 of 72 results for "Guillaume Arnoux H%C3%A9bert" clear search
06b EiLab_Model_I_V5.00 NL
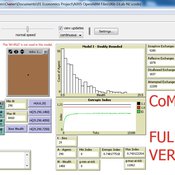
Garvin Boyle | Published Saturday, October 05, 2019EiLab - Model I - is a capital exchange model. That is a type of economic model used to study the dynamics of modern money which, strangely, is very similar to the dynamics of energetic systems. It is a variation on the BDY models first described in the paper by Dragulescu and Yakovenko, published in 2000, entitled “Statistical Mechanics of Money”. This model demonstrates the ability of capital exchange models to produce a distribution of wealth that does not have a preponderance of poor agents and a small number of exceedingly wealthy agents.
This is a re-implementation of a model first built in the C++ application called Entropic Index Laboratory, or EiLab. The first eight models in that application were labeled A through H, and are the BDY models. The BDY models all have a single constraint - a limit on how poor agents can be. That is to say that the wealth distribution is bounded on the left. This ninth model is a variation on the BDY models that has an added constraint that limits how wealthy an agent can be? It is bounded on both the left and right.
EiLab demonstrates the inevitable role of entropy in such capital exchange models, and can be used to examine the connections between changing entropy and changes in wealth distributions at a very minute level.
…
Peer reviewed Infectious diseases model for mixed-methods research chapter
Mark Moritz Ian M Hamilton Chelsea E Hunter Daniel C Peart | Published Sunday, January 30, 2022The purpose of this curricular model is to teach students the basics of modeling complex systems using agent-based modeling. It is a simple SIR model that simulates how a disease spreads through a population as its members change from susceptible to infected to recovered and then back to susceptible. The dynamics of the model are such that there are multiple emergent outcomes depending on the parameter settings, initial conditions, and chance.
The curricular model can be used with the chapter Agent-Based Modeling in Mixed Methods Research (Moritz et al. 2022) in the Handbook of Teaching Qualitative & Mixed Methods (Ruth et al. 2022).
The instructional videos can be accessed on YouTube: Video 1 (https://youtu.be/32_JIfBodWs); Video 2 (https://youtu.be/0PK_zVKNcp8); and Video 3 (https://youtu.be/0bT0_mYSAJ8).
DARTS: an agent-based model of the global food system for studying its resilience to shocks
Hubert Fonteijn | Published Wednesday, November 22, 2023DARTS simulates food systems in which agents produce, consume and trade food. Here, food is a summary item that roughly corresponds to commodity food types (e.g. rice). No other food types are taken into account. Each food system (World) consists of its own distribution of agents, regions and connections between agents. Agents differ in their ability to produce food, earn off-farm income and trade food. The agents aim to satisfy their food requirements (which are fixed and equal across agents) by either their own food production or by food purchases. Each simulation step represents one month, in which agents can produce (if they have productive capacity and it is a harvest month for their region), earn off-farm income, trade food (both buy and sell) and consume food. We evaluate the performance of the food system by averaging the agents’ food satisfaction, which is defined as the ratio of the food consumed by each agent at the end of each month divided by her food requirement. At each step, any of the abovementioned attributes related to the agents’ ability to satisfy their food requirement can (temporarily) be shocked. These shocks include reducing the amount of food they produce, removing their ability to trade locally or internationally and reducing their cash savings. Food satisfaction is quantified (both immediately after the shock and in the year following the shock) to evaluate food security of a particular food system, both at the level of agent types (e.g. the urban poor and the rural poor) and at the systems level. Thus, the effects of shocks on food security can be related to the food system’s structure.
Animal territory formation (Reusable Building Block RBB)
Volker Grimm Stephanie Kramer-Schadt Robert Zakrzewski | Published Sunday, November 12, 2023This is a generic sub-model of animal territory formation. It is meant to be a reusable building block, but not in the plug-and-play sense, as amendments are likely to be needed depending on the species and region. The sub-model comprises a grid of cells, reprenting the landscape. Each cell has a “quality” value, which quantifies the amount of resources provided for a territory owner, for example a tiger. “Quality” could be prey density, shelter, or just space. Animals are located randomly in the landscape and add grid cells to their intial cell until the sum of the quality of all their cells meets their needs. If a potential new cell to be added is owned by another animal, competition takes place. The quality values are static, and the model does not include demography, i.e. mortality, mating, reproduction. Also, movement within a territory is not represented.
Hybrid traffic model
Patrick Taillandier Arnaud Banos Nathalie Corson | Published Thursday, March 16, 2017The model aims at simulating the car traffic. It allows to use either a macro or a micro sub-model for the simulation of the flow on the roads.
An agent-based model for assessing strategies of adaptation to climate and tourism demand changes in an alpine destination
Stefano Balbi Marco Alberti | Published Monday, February 14, 2011 | Last modified Saturday, April 27, 2013The model is then used for assessing three hypothetical and contrasted infrastructure-oriented adaptation strategies for the winter tourism industry, that have been previously discussed with local stakeholders, as possible alternatives to the “business-as-usual” situation.
Enhancing recycling of construction materials; an agent based model with empirically based decision parameters
Igor Nikolic Claudia Binder Christof Knoeri Hans-Joerg Althaus | Published Sunday, October 21, 2012 | Last modified Monday, June 09, 2014This model allows for analyzing the most efficient levers for enhancing the use of recycled construction materials, and the role of empirically based decision parameters.
Evacuation of the city of Rouen using the GAMA advanced driving skill
Guillaume Czura Patrick Taillandier Pierrick Tranouez Eric Daudé | Published Thursday, April 25, 2019Model that illustrates the use of the GAMA advanced driving skill through a case study concerning the evacuation of the city of Rouen (France).
WeDiG Sim
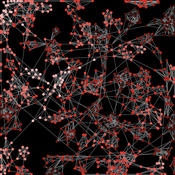
Reza Shamsaee | Published Monday, May 14, 2012 | Last modified Saturday, April 27, 2013WeDiG Sim- Weighted Directed Graph Simulator - is an open source application that serves to simulate complex systems. WeDiG Sim reflects the behaviors of those complex systems that put stress on scale-free, weightedness, and directedness. It has been implemented based on “WeDiG model” that is newly presented in this domain. The WeDiG model can be seen as a generalized version of “Barabási-Albert (BA) model”. WeDiG not only deals with weighed directed systems, but also it can handle the […]
Alternative scenarios of green consumption in Italy: an empirically grounded model.
Giangiacomo Bravo Elena Vallino Alessandro K Cerutti Maria Beatrice Pairotti | Published Thursday, March 28, 2013 | Last modified Saturday, April 27, 2013We provide a full description of the model following the ODD protocol (Grimm et al. 2010) in the attached document. The model is developed in NetLogo 5.0 (Wilenski 1999).
Displaying 10 of 72 results for "Guillaume Arnoux H%C3%A9bert" clear search