Our mission is to help computational modelers develop, document, and share their computational models in accordance with community standards and good open science and software engineering practices. Model authors can publish their model source code in the Computational Model Library with narrative documentation as well as metadata that supports open science and emerging norms that facilitate software citation, computational reproducibility / frictionless reuse, and interoperability. Model authors can also request private peer review of their computational models. Models that pass peer review receive a DOI once published.
All users of models published in the library must cite model authors when they use and benefit from their code.
Please check out our model publishing tutorial and feel free to contact us if you have any questions or concerns about publishing your model(s) in the Computational Model Library.
Displaying 10 of 75 results urban clear search
Tragedy of the Commons with Environmental Feedback: A Model of Human-AI Socio-Environmental Water Dilemma
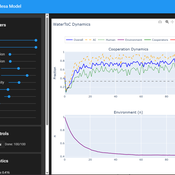
Ivana Malcic Luka Waronig Andrew Crossley | Published Saturday, July 05, 2025 | Last modified Sunday, July 06, 2025This project is an interactive agent-based model simulating consumption of a shared, renewable resource using a game-theoretic framework with environmental feedback. The primary function of this model was to test how resource-use among AI and human agents degrades the environment, and to explore the socio-environmental feedback loops that lead to complex emergent system dynamics. We implemented a classic game theoretic matrix which decides agents´ strategies, and added a feedback loop which switches between strategies in pristine vs degraded environments. This leads to cooperation in bad environments, and defection in good ones.
Despite this use, it can be applicable for a variety of other scenarios including simulating climate disasters, environmental sensitivity to resource consumption, or influence of environmental degradation to agent behaviour.
The ABM was inspired by the Weitz et. al. (2016, https://pubmed.ncbi.nlm.nih.gov/27830651/) use of environmental feedback in their paper, as well as the Demographic Prisoner’s Dilemma on a Grid model (https://mesa.readthedocs.io/stable/examples/advanced/pd_grid.html#demographic-prisoner-s-dilemma-on-a-grid). The main innovation is the added environmental feedback with local resource replenishment.
Beyond its theoretical insights into coevolutionary dynamics, it serves as a versatile tool with several practical applications. For urban planners and policymakers, the model can function as a ”digital sandbox” for testing the impacts of locating high-consumption industrial agents, such as data centers, in proximity to residential communities. It allows for the exploration of different urban densities, and the evaluation of policy interventions—such as taxes on defection or subsidies for cooperation—by directly modifying the agents’ resource consumptions to observe effects on resource health. Furthermore, the model provides a framework for assessing the resilience of such socio-environmental systems to external shocks.
…
Peer reviewed Urban Transport Mode Choices
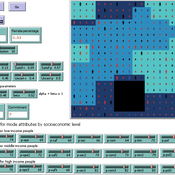
Kathleen Salazar -Serna Lorena Cadavid Carlos Franco | Published Thursday, May 22, 2025The model represents urban commuters’ transport mode choices among cars, public transit, and motorcycles—a mode highly prevalent in developing countries. Using an agent-based modeling approach, it simulates transport dynamics and serves as a testbed for evaluating policies aimed at improving mobility.
The model simulates an ecosystem of human agents who decide, at each time step, which mode of transportation to use for commuting to work. Their decision is based on a combination of personal satisfaction with their most recent journey—evaluated across a vector of individual needs—the information they crowdsource from their social network, and their personal uncertainty regarding trying new transport options.
Agents are assigned demographic attributes such as sex, age, and income level, and are distributed across city neighborhoods according to their socioeconomic status. To represent social influence in decision-making, agents are connected via a scale-free social network topology, where connections are more likely among agents within the same socioeconomic group, reflecting the tendency of individuals to form social ties with similar others.
…
Transfer of Development Rights (TDR) Simulation for Compact Urban Growth in Dublin: An Agent-Based Model in NetLogo
ajithvyas | Published Wednesday, May 14, 2025This agent-based model simulates the implementation of a Transfer of Development Rights (TDR) mechanism in a stylized urban environment inspired by Dublin. It explores how developer agents interact with land parcels under spatial zoning, conservation protections, and incentive-based policy rules. The model captures emergent outcomes such as compact growth, green and heritage zone preservation, and public cost-efficiency. Built in NetLogo, the model enables experimentation with variable FSI bonuses, developer behavior, and spatial alignment of sending/receiving zones. It is intended as a policy sandbox to test market-aligned planning tools under behavioral and spatial uncertainty.
Peer reviewed WaDemEsT-Water Demand Estimation Tool for Residential Areas
Kamil Aybuğa | Published Tuesday, February 18, 2025This model simulates household water consumption patterns in an urban environment. Its current setup compares monthly water consumption data, and the results of a daily heuristic water demand model with the simulation results produced by household demographics that is fine tuned via some base demand model. It’s designed to estimate and analyze water demand based on various factors including household demographics, daily routines of residents (working, weekending, vacation patterns), weather conditions (temperature and precipitation), appliance usage patterns, seasonal variations, and special periods such as weekends and holidays. The model aims to help understand how different factors influence residential water consumption and can be used for water demand forecasting and management.
Peer reviewed Behavioral Dynamics of Epidemic Trajectories and Vaccination Strategies: An Agent-Based Model
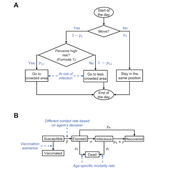
Ziyuan Zhang | Published Tuesday, December 10, 2024This agent-based model explores the dynamics between human behavior and vaccination strategies during COVID-19 pandemics. It examines how individual risk perceptions influence behaviors and subsequently affect epidemic outcomes in a simulated metropolitan area resembling New York City from December 2020 to May 2021.
Agents modify their daily activities—deciding whether to travel to densely populated urban centers or stay in less crowded neighborhoods—based on their risk perception. This perception is influenced by factors such as risk perception threshold, risk tolerance personality, mortality rate, disease prevalence, and the average number of contacts per agent in crowded settings. Agent characteristics are carefully calibrated to reflect New York City demographics, including age distribution and variations in infection probability and mortality rates across these groups. The agents can experience six distinct health statuses: susceptible, exposed, infectious, recovered from infection, dead, and vaccinated (SEIRDV). The simulation focuses on the Iota and Alpha variants, the dominant strains in New York City during the period.
We simulate six scenarios divided into three main categories:
1. A baseline model without vaccinations where agents exhibit no risk perception and are indifferent to virus transmission and disease prevalence.
…
Construction and Demolition model to track material flows and embodied carbon
Jonathan Edgardo Cohen | Published Monday, September 30, 2024Reusing existing material stocks in developed built environments can significantly reduce the environmental footprint of the construction and demolition sector. However, material reuse in urban areas presents technical, temporal, and geographical challenges. Although a better understanding of spatial and temporal changes in material stocks could improve city resource management, limited scientific contributions have addressed this challenge.
This study details the steps followed in developing a spatially explicit rule-based simulation of materials stock. The simulation provides a proof of concept by incorporating the spatial and temporal dimensions of construction and demolition activities to analyse how various urban parameters determine material flows and embodied carbon in urban areas. The model explores the effects of 1) re-using recycled materials, 2) demolitions, 3) renovations and 4) various building typologies.
To showcase the model’s capabilities, the residential building stock of Gothenburg City is used as a case study, and eight building materials are tracked. Environmental impacts (A1-A3) are calculated with embodied carbon factors. The main parameters are explored in a baseline scenario. Then, a second scenario focuses on a hypothetical policy that promotes improvements in building energy performance.
The simulation can be expanded to include more materials and built environment assets and allows for future explorations on, for example, the role of logistics, the implementation of recycling or reuse stations, and, in general, supporting sustainable and circular strategies from the construction sector.
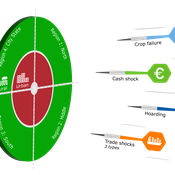
DARTS: modelling effects of shocks on global, regional, urban and rural food security
Geerten Hengeveld Hubert Fonteijn Pepijn van Oort | Published Tuesday, June 18, 2024Food trade networks represent a complex system where food is periodically produced in different regions of the world. Food is continuously stocked and traded. Food security in a globalised world is vulnerable to shocks. We present DARTS, a new agent based model that models monthly dynamics of food production, trade, stocking, consumption and food security for different interconnected world regions and a city state. Agents in different regions differ in their harvest seasons, wealth (rich and poor), degree of urbanisation and connection to domestic and global markets. DARTS was specifically designed to model direct and indirect effects of shocks in the food system. We introduce a new typology of 6 distinct shock types and analyse their impact on food security, modelling local and global effects and short term and longer term effects. An second important scientific novelty of the model is that DARTS can also model indirect effects of shocks (cascading in space and in time, lag effects due to trade and food stock buffering). A third important scientific novelty of the model is its’ capability of modelling food security at different scales, in which the rural/urban divide and differences in (intra-annually varying) production and trade connections play a key role. At the time of writing DARTS is yet insufficiently parameterised for accurate prediction for real world regions and cities. Simulations for a hypothetical in silico world with 3 regions and a city state show that DARTS can reproduce rich and complex dynamics with analogues in the real world. The scientific interest is more on deepening insight in process dynamics and chains of events that lead to ultimate shock effects on food security.
Integrate land use policies into the agent-based model to simulate land use change
Jing Gao | Published Sunday, June 09, 2024This study employs a hierarchical cross-departmental ABM to explore the question: How and to what extent are the land use policies enforced when assessed against the real-world land use pattern? Specifically, two sub-questions are of interest: How can real-world policy interactions be abstracted into the behavior across hierarchical governmental departments in the model? How can the level of enforcement for each land use policy be quantified under these interactions? We build three hierarchical agents—the central level, the local level that incorporates three departments, and the village collective level—with simplified but plausible processes of land use change, with levels of enforcement of different land use policies as key parameters. We calibrate the model using a genetic algorithm to determine those parameters and answer our research question. We further applied the model to simulate potential land use changes and investigate the implications of different policy options. The results are expected to provide insights into the intricate relationships shaping land use processes, contributing to evidence-based decision-making in urban planning and sustainable land use management.
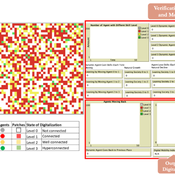
Digital Mobility Model (DMM)
Na (Richard) Jiang Fiammetta Brandajs | Published Thursday, February 01, 2024 | Last modified Friday, February 02, 2024The purpose of the Digital Mobility Model (DMM) is to explore how a society’s adoption of digital technologies can impact people’s mobilities and immobilities within an urban environment. Thus, the model contains dynamic agents with different levels of digital technology skills, which can affect their ability to access urban services using digital systems (e.g., healthcare or municipal public administration with online appointment systems). In addition, the dynamic agents move within the model and interact with static agents (i.e., places) that represent locations with different levels of digitalization, such as restaurants with online reservation systems that can be considered as a place with a high level of digitalization. This indicates that places with a higher level of digitalization are more digitally accessible and easier to reach by individuals with higher levels of digital skills. The model simulates the interaction between dynamic agents and static agents (i.e., places), which captures how the gap between an individual’s digital skills and a place’s digitalization level can lead to the mobility or immobility of people to access different locations and services.
The Urban Drought Nexus Tool
Roger Cremades Muhamad Khairulbahri | Published Thursday, December 14, 2023The “Urban Drought Nexus Tool” is a system dynamics model, aiming to facilitate the co-development of climate services for cities under increasing droughts. The tool integrates multiple types of information and still can be applied to other case studies with minimal adjustments on the parameters of land use, water consumption and energy use in the water sector. The tool needs hydrological projections under climate scenarios to evaluate climatic futures, and requires the co-creation of socio-economic future scenarios with local stakeholders. Thus it is possible to provide specific information about droughts taking into account future water availability and future water consumption. Ultimately, such complex system as formed by the water-energy-land nexus can be reduced to single variables of interest, e.g. the number of events with no water available in the future and their length, so that the complexities are reduced and the results can be conveyed to society in an understandable way, including the communication of uncertainties. The tool and an explanatory guide in pdf format are included. Planned further developments include calibrating the system dynamics model with the social dynamics behind each flow with agent-based models.
Displaying 10 of 75 results urban clear search