Our mission is to help computational modelers develop, document, and share their computational models in accordance with community standards and good open science and software engineering practices. Model authors can publish their model source code in the Computational Model Library with narrative documentation as well as metadata that supports open science and emerging norms that facilitate software citation, computational reproducibility / frictionless reuse, and interoperability. Model authors can also request private peer review of their computational models. Models that pass peer review receive a DOI once published.
All users of models published in the library must cite model authors when they use and benefit from their code.
Please check out our model publishing tutorial and feel free to contact us if you have any questions or concerns about publishing your model(s) in the Computational Model Library.
Displaying 10 of 247 results for "netlogo" clear search
ZIP-Level Housing Supply Elasticity and Crash Dynamics: A GIS-Based Agent-Based Model of the Washington DC and Northern Virginia Metro Region
Mansoor Abdul Bari | Published Saturday, August 01, 2026 | Last modified Sunday, August 02, 2026This model tests whether local housing supply elasticity governs crash severity inside a single metropolitan housing market. Saiz (2010) established that across US metros, regions constrained by geography and regulation experience deeper boom-bust cycles than flexible ones. That finding is routinely applied downward to neighborhoods and ZIP codes as though the mechanism scaled without qualification.
The empirical record for the Washington DC and Northern Virginia region says it does not. Across 84 ZIP codes, measured supply elasticity ranges from 0.35 to 4.95 with a median of 1.21. The worst single-year price decline between 2007 and 2012 averaged 9.6 percent in constrained ZIP codes and 9.0 percent in flexible ones, a gap that cannot be distinguished from noise. Wide variation in the proposed cause, no meaningful separation in the proposed effect.
The model embeds households, houses and a metro-wide credit condition in the real ZIP geography of the region using three GIS layers and an empirical price panel. Local elasticity governs construction, exactly as theory predicts. Prices are driven by a shared macro drift schedule and, under the credit-amplified mode, by a leverage cycle with a financial accelerator and a deviation penalty. The design question is whether those shared forces are sufficient to override local supply differences at the sub-metropolitan scale.
…
Hominin Ecodynamics v.1.1 (update for perception and interaction)
C Michael Barton | Published Wednesday, August 15, 2012 | Last modified Saturday, April 27, 2013Models land-use, perception, and biocultural interactions between two forager populations.
COMM-PDND: Communication-Based Model of Perceived Descriptive Norm Dynamics in Digital Networks
Lars Reinelt | Published Friday, September 08, 2023The Communication-Based Model of Perceived Descriptive Norm Dynamics in Digital Networks (COMM-PDND) is an agent-based model specifically created to examine the dynamics of perceived descriptive norms in the context of digital network structures. The model, developed as part of a master’s thesis titled “The Dynamics of Perceived Descriptive Norms in Digital Network Publics: An Agent-Based Simulation,” emphasizes the critical role of communication processes in norm formation. It focuses on the role of communicative interactions in shaping perceived descriptive norms.
The COMM-PDND is tuned to explore the effects of normative deviance in digital social networks. It provides functionalities for manipulating agents according to their network position, and has a versatile set of customizable parameters, making it adaptable to a wide range of research contexts.
CA-MRSA Demonstration Model
Jonathan Ozik Charles Macal Kenneth Letendre Irene Lee | Published Tuesday, January 06, 2015We demonstrate how a simple model of community associated Methicillin-resistant Staphylococcus aureus (CA-MRSA) can be easily constructed by leveraging the statecharts and ReLogo capabilities in Repast Simphony.
Peer reviewed STiMUS: A Stigmergic–Mutualistic Agent-Based Model of Teamwork on Shared Digital Artefacts (IMOI)
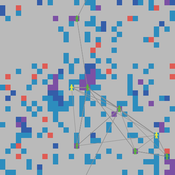
Yevgeny Patarakin | Published Friday, July 03, 2026 | Last modified Wednesday, July 22, 2026STiMUS (Stigmergic–Mutualistic IMOI Model) is an agent-based model of teamwork in socio-technical systems where contributors collaborate through shared digital artefacts — wiki pages, code files, issue tickets, project cards, Scratch projects — represented as patches in a NetLogo world. The model integrates two coordination mechanisms. Stigmergy is indirect coordination through traces left in a shared environment: each edit deposits a pheromone that diffuses to neighbouring patches and evaporates over time, so recent activity attracts further contributions. Mutualism is a reciprocal benefit loop in which valuable, well-maintained artefacts raise contributor motivation and shared understanding, while motivated contributors improve artefacts.
Contributors (turtles of the contributor breed) carry individual state: skill, motivation, shared-mental-model, specialty, benefit-gain, and an explicit-mode flag. At each tick every contributor selects a target artefact with an ant-colony-optimization-style rule weighing the artefact’s pheromone, incompleteness (1 - completeness), resource-value, and topic match between specialty and the artefact’s topic-tag; with probability p-explicit it instead takes the patch with the highest maintenance-need, modelling explicit task assignment. Each edit increases pheromone, quality, completeness and reuse-count, raises resource-value, lowers maintenance-need, and appends the editor to the artefact’s edit-authors list. When the previous last-editor-id differs from the current editor, the Edit Succession Ratio rises, the editor’s shared-mental-model grows, and a co-editing link is created — operationalising the idea that repeated cross-author succession on the same artefact builds shared understanding. Contributors’ motivation is updated from the benefit drawn from the visited artefact.
Each patch maintains a stigmergic layer (pheromone, quality, completeness, recentness, last-editor-id, edit-count, edit-authors) and a mutualistic layer (resource-value, reuse-count, maintenance-need, topic-tag), plus task flags (is-task?, task-complexity). Global monitors report the Edit Succession Ratio (ESR = cross-author-edits / total-edits, and an alternative esr-value = share of edited patches with more than one distinct author), mean-quality, mean-resource-value, a mutualism-index averaging contributor benefit and resource value, coediting-density (network density of the co-editing graph), active-pages-share, and task-completion-rate. The model logs every edit as a bipartite edge (tick, author_id, pageid, specialty, topic_tag, quality), exportable to CSV.
…
Peer Review Model
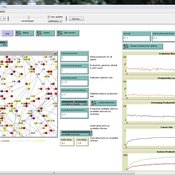
Flaminio Squazzoni Claudio Gandelli | Published Wednesday, September 05, 2012 | Last modified Saturday, April 27, 2013This model looks at implications of author/referee interaction for quality and efficiency of peer review. It allows to investigate the importance of various reciprocity motives to ensure cooperation. Peer review is modelled as a process based on knowledge asymmetries and subject to evaluation bias. The model includes various simulation scenarios to test different interaction conditions and author and referee behaviour and various indexes that measure quality and efficiency of evaluation […]
Peer reviewed The Indus Village's Weather model: procedural generation of daily weather
Andreas Angourakis | Published Tuesday, May 13, 2025Overview
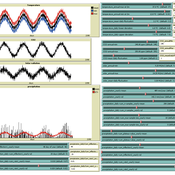
The Weather model is a procedural generation model designed to create realistic daily weather data for socioecological simulations. It generates synthetic weather time series for solar radiation, temperature, and precipitation using algorithms based on sinusoidal and double logistic functions. The model incorporates stochastic variation to mimic unpredictable weather patterns and aims to provide realistic yet flexible weather inputs for exploring diverse climate scenarios.
The Weather model can be used independently or integrated into larger models, providing realistic weather patterns without extensive coding or data collection. It can be customized to meet specific requirements, enabling users to gain a better understanding of the underlying mechanisms and have greater confidence in their applications.
…

SERDUX-MARCIM: agent-based simulation of cyberattack propagation in maritime critical infrastructure
Diego Edison Cabuya Padilla Carlos A Castaneda-Marroquin Daniel Díaz-López | Published Thursday, August 20, 2026SERDUX-MARCIM simulates the propagation of a cyberattack over the computational network of an organization in the maritime sector, at the strategic level of decision-making. It is the instantiation of ABM-MARCIM, the agent-based model of the MARCIM framework for the modeling and simulation of maritime cyberdefense.
Every computational asset of the target organization – servers, endpoints, routers, gateways, vessel systems, radars – is an agent that occupies one of six states at each time step: Susceptible, Exposed, Resistant, Degraded, Unavailable or Destroyed, the initials of which give the model its name. The states Degraded, Unavailable and Destroyed are associated with the D5 cyberattack effects (disrupt, degrade, deny, destroy, deceive) as a function of the degree and the duration of the attack. Thirteen transitions between states are admissible.
Unlike a conventional agent-based model, the local update function is not an individual behavioral rule. It is a system of six ordinary differential equations with eight time-dependent transition rates – propagation, cyberattack (degraded), cyberattack (unavailable), cyberattack (destroyed), recovery, sanitation, loss of resistance, and unavailability by other causes. The values of those rates derive from the capabilities of the target organization, the capabilities of the attacker, and the degree and duration of the cyberattack, computed through a cyber risk approach aligned with the OWASP Risk Rating Methodology, the ISACA categorization of security controls and the IMO Guidelines on Maritime Cyber Risk Management.
…
Model of communication between two groups of managers in the course of project implementation
Smarzhevskiy Ivan | Published Monday, December 07, 2020This is a simulation model of communication between two groups of managers in the course of project implementation. The “world” of the model is a space of interaction between project participants, each of which belongs either to a group of work performers or to a group of customers. Information about the progress of the project is publicly available and represents the deviation Earned value (EV) from the planned project value (cost baseline).
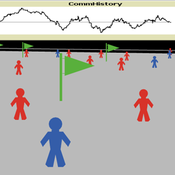
The key elements of the model are 1) persons belonging to a group of customers or performers, 2) agents that are communication acts. The life cycle of persons is equal to the time of the simulation experiment, the life cycle of the communication act is 3 periods of model time (for the convenience of visualizing behavior during the experiment). The communication act occurs at a specific point in the model space, the coordinates of which are realized as random variables. During the experiment, persons randomly move in the model space. The communication act involves persons belonging to a group of customers and a group of performers, remote from the place of the communication act at a distance not exceeding the value of the communication radius (MaxCommRadius), while at least one representative from each of the groups must participate in the communication act. If none are found, the communication act is not carried out. The number of potential communication acts per unit of model time is a parameter of the model (CommPerTick).
The managerial sense of the feedback is the stimulating effect of the positive value of the accumulated communication complexity (positive background of the project implementation) on the productivity of the performers. Provided there is favorable communication (“trust”, “mutual understanding”) between the customer and the contractor, it is more likely that project operations will be performed with less lag behind the plan or ahead of it.
The behavior of agents in the world of the model (change of coordinates, visualization of agents’ belonging to a specific communicative act at a given time, etc.) is not informative. Content data are obtained in the form of time series of accumulated communicative complexity, the deviation of the earned value from the planned value, average indicators characterizing communication - the total number of communicative acts and the average number of their participants, etc. These data are displayed on graphs during the simulation experiment.
The control elements of the model allow seven independent values to be varied, which, even with a minimum number of varied values (three: minimum, maximum, optimum), gives 3^7 = 2187 different variants of initial conditions. In this case, the statistical processing of the results requires repeated calculation of the model indicators for each grid node. Thus, the set of varied parameters and the range of their variation is determined by the logic of a particular study and represents a significant narrowing of the full set of initial conditions for which the model allows simulation experiments.
…
PopComp
Andre Costopoulos | Published Thursday, December 10, 2020PopComp by Andre Costopoulos 2020
[email protected]
Licence: DWYWWI (Do whatever you want with it)
I use Netlogo to build a simple environmental change and population expansion and diffusion model. Patches have a carrying capacity and can host two kinds of populations (APop and BPop). Each time step, the carrying capacity of each patch has a given probability of increasing or decreasing up to a maximum proportion.
…
Displaying 10 of 247 results for "netlogo" clear search