Universal Darwinism in Dutch Greenhouses 1.0.0
Project overview
The model depicts technology adoption for the greenhouse sector in the Westland, based on the three principles of Universal Darwinism: variation, selection and inheritance. Greenhouse farmers buy technologies for their greenhouses to try to earn as much money as possible. The decision to buy a technology is based on different factors. In this project we will focus on personal experience and information supplied by peers. The model describes how greenhouse farmers gain information and make decisions about acquiring technologies. We are interested in whether the system approaches convergence on technologies that provide the most benefit and which factors are of influence on the final result and speed of this process.
The model will be specified both abstract and simple, making it suited to be made more real and/or to be used for other industries.
1. Problem formulation and system identification
1.1 What is the problem of interest?
Once a technology has been invented (the innovation) it is not necessarily bought (the adoption) by every one that could make use of it. The effect of an innovation on society (e.g. sustainability) is however determined by the number of people that adopt the innovation. The process of adoption of an innovation within the group of potential adopters is called diffusion and this is the subject of this report. Many papers have been written about this revealing different views on important factors, models to use, governing process and overall system behaviour.
One of these views is that Universal Darwinism (UD) may be governing the process of technology diffusion. In biology, processes characterised by variation, selection and inheritance were recognised by Darwin to be a valid explanation for the diversity, adaptive complexity and distribution of species, and called this process descent with modification or natural selection. Case studies suggest that these characteristics are true of the greenhouse horticulture industry (and perhaps many others), which may be better explained with a UD-based diffusion model than they are under the current diffusion model.
So we have built a fairly abstract model of technology diffusion in the Westland greenhouse area that can be expanded and also be used for other sectors.
1.1.1 What is the observed macroscopic regularity that is of interest to us?
Diversity, adaptive complexity, and uneven distribution, like that of species, and an logistic function for the diffusion of more successful technologies compared to others.
Both technologies (e.g. different CHP systems) and greenhouses (size, crop) are heterogeneous, so a great number of possible combinations of technology in use by a greenhouse exist. Some technologies perform better than others, and the better technologies will likely be:
- be retained by farmers who already have them
- be reported as positive when information is between farmers
- be obtained by additional farmers
- used more often
However, due to imperfect information and the fact that technologies cannot be replaced at any instance, not all farmers will use the technologies that are the best for them at all times, leading to the macroscopic regularities of interest.
1.2 Whose problem is it?
Many actors may benefit from this (farmers, authorities, technology sellers, society). Also when this kind of models will (they probably will) be built in the future Science could be called the problem owner.
2. System decomposition
2.1 Agent properties
There is only one kind of agent, representing a greenhouse farmer/greenhouse business (social and technnical aspects) that:
- have a certain amount of money (integer).
- make profit per year (integer)
- own technologies; a list of the current technologies the company has.
- have an opinion about currently owned technologies . (integer >= -1 and <= 1).
- have a list of all known technologies (list of lists).
- have an opinion of all known technologies (list of lists of integers >= -1 and <= 1).
- have a stubborness quotien, describing how much they value their own opinion with respect to others (integer >= 0 and <= 1).
- have an opinion change rate; describing how much new opinions way against old opinions (like a memory) (integer >= 0 and <= 1).
- have company specifications.
The company specifications are:
- a surface area (integer between 1 and 25, distributed according to powerlaw distribution)
- a crop designation (either 0 or 1, representing vegetable or flower)
Each crop designation has:
- a base cost; describing what costs are made regardless of any technology or operation (integer >= 0).
- surface dependent operating costs; describing the cost of operation regardless of the use of technology (integer >= 0).
- base production; describing the amount of product produced regardless of the use of any technology (integer >= 0)
Technologies have:
- a technology category they belong to (integer).
- a price dependent on the size of the company it is used for (integer >= 0) (multiplied by surface ^ 0.8 in the model).
- a value for cost; representing all extra costs that will be made when this technology is used (integer).
- a value for performance; representing the increase in production (integer).
- a lifespan, representing how long a technology functions (integer >= 0).
- an age; representing how long a technology is in use by a company (integer >= 0 and <= lifespan).
2.2 Agent relationships
Agents are linked to neighbours according to preferential attachment. Agents use this network, and a user defined network degree setting (integer >= 1 and <= infinity) to determine each agent’s neighbours.
2.3 Actions
Agents:
- calculate profits by looking at the production from the last step minus their crop designation costs, the operating costs for the current technologies, and the price of the products.
- add the profit to their money variable
- compare their profit to that of their neighbours
- update the satisfaction of their current technologies based on comparison to their neighbours’ profit
- look at the current technologies of neighbours and update list of all known technologies
- look at satisfaction of neighbours with their current technologies
- update opinion of all known technologies by incorporating satisfaction of neighbours according to stubbornness and opinion change rate values
- check current age against lifespan of all current technologies
- replace any technologies with current age = lifespan by picking a technology from the same technology category as the expired technology, and for which they have the highest opinion and can afford. (The new technology cannot cost more than the budget variable, as set by user, in relation to their money value
- subtract technology costs from money
If money variable ever drops below 0, agents are reinitialized (current technologies are randomized, opinions are wiped, money is reset, and crop designation is randomized.)
2.4 Environment
The environment:
- purchases the crops according to a price list (constant in the model)
- sells technologies according to a list of technologies (with category, price, operating costs, effect on production included) (constant in the model) (list).
- determines the base production for each company type (list).
- determines the operating cost per surface for each company type (list).
- determines the base costs for each company type (list).
3. Behavior identification
3.1 Model narrative
First the initialization step is discussed and then the recurring time step.
3.1.1 Initialization
- The environment generates the number of company types (manual input).
- The environment generates the company type dependent variables (all manual input):
- Product prices.
- Base costs.
- Base production per surface.
- Operating costs per surface.
- The environment generates the number of technology categories and also (all manual input)
- the number of technologies per category and also
- the lifespans of all the technologies.
- the prices of all the technologies.
- the costs of usage per surface for all company types for all technologies.
- the increase in production per surface for all company types for all technologies.
- Costs & productivities per company type
- Technology categories & technologies
- Costs, benefits and life spans of technologies
- the number of technologies per category and also
-
The environment creates a library of all technologies that exist.
-
The companies are generated and linked to another company with preferential attachment (with possibility of visualisation).
- The companies get their surface are (reflected in visualisation)
- The companies get their company specifications:
- Type
- Base Costs
- Operating costs
- Base production
- Random starting technologies from universal library
- Technology library is filled with owned technologies
- Life spans of technologies
- Costs of technologies
- Production increase of technologies
- Age of technologies
- Starting funds
- Empty opinion library (zero’s)
- Type
- The companies add the technologies of their neighbours to their technology library
3.1.2 Time step
Companies will:
- calculate their profits, based on
- profit = revenues - costs
- costs = base cost + surface * (operating cost + sum(technology costs))
- Basecost and operating cost are company type dependent
- Technology costs is dependent on owned technologies and the company type
- revenues = price * surface * (base production + sum(performance))
- price is dependent on the company type
- base production is dependent on the company type
- performance is dependent on owned technologies and the company type
- costs = base cost + surface * (operating cost + sum(technology costs))
- the profit is added to the account balance
- profit = revenues - costs
- update their satisfaction with respect to profit made
- the average income per surface of companies’ neighbors (or all companies in the model; slider) is compared to the income per surface of a company, converting the difference into a value * between -1 and 1.
- update their technology libraries
- if neighbors (passive agents; depending on the degree) own a technology that is not yet present in its own (active agent) technology library
- this technology is added to the technology library of the company (active agent)
- the mean value of the opinion libraries of the neighbours (passive agents) for this new technology will be modified by the stubbornness and then copied to opinion library of the active agent.
- if neighbors (passive agents; depending on the degree) own a technology that is not yet present in its own (active agent) technology library
- update their opinion library based on its satisfaction and the satisfaction from other companies.
- the company generate a list (new opinion) with an entry for each technology it knows of
- For each technology a new opinion will be formed by adding following:
- if it owned by the company: stubborness * own satisfaction
- for all the neighbours (depending on the degree) of the company that own the technology: (1 - stubborness) * satisfaction / number of agents owning the technology
- depending on the opinion change rate the previous opinion will be taken into account in calculating the new opinion: (1 - opinion change rate) * old opinion + opinion change rate * new opinion
- To introduce noise into the model companies have a chance to give a wrong value for their satisfaction
- check if they still have a positive amount of money and
- get new company specifications (see: 3.1.1 Initialisation)
- check whether technologies need to be replaced.
- if a technology has the same age as its life span it will be replaced
- by a technology from the same technology category that is in the technology library of the company.
- the best technology (opinion library) that is within budget (budget*money) is chosen.
- if no technologies are within budget the cheapest is chosen.
- by a technology from the same technology category that is in the technology library of the company.
- if a technology has the same age as its life span it will be replaced
- age all technologies by one tick.
4. Model formalisation
Netlogo
4.1 The main modeling assumptions are:
No physical distance - The transfer of information is expected to take place regardless of the physical distance. Communication technology and the fact that the Westland is just a small area are enough reason for that. Furthermore, the real world physical processes of the movement of technology and products are not explicitly modelled because they aren’t expected important for the problem.
Technologies randomly distributed - In the first model the available technologies will be constant and no technologies are explicitly fed to the model to see them diffuse though the agent set. Rather the agents that are assigned relatively good technologies are expected to act as a source of the diffusion process. In later versions options may be implemented to introduce more efficient technologies and remove other technologies, reflecting technological advancements and also prohibition of the use of technologies by the government. We believe that if our model will run based on this assumption we can show enough of the technology diffusion process for now.
Agents do not die or change surface - In the real world a company that goes bankrupt will probably be disconnected from the social network there may not be even another greenhouse farmer on the same plot. However, since making adjustments in the network will have great influence on the working of the model (opinion updates make use of the neighbours), especially when an agent with many neighbours is taken out, we have chosen to keep the social network intact. When an agent goes bankrupt it will just get new company specifications and its libraries are reset. The surface will however remain the same because physically speaking this is correct.
Different effects on company types - In the real world there are many factors that determine how effective a technology is for a certain company. This means that the same technology probably has a different effect on different companies (adding uncertainty to information about technologies). To put some of this in our the technologies have gotten different effects depending on the company type.
Time step one year - Acquisition of technology, selling products and sharing information are all processes that mostly happen multiple (irregular) times per year. However for matters of simplification we have taken a time step of one year in which all of these processes occur once. At a scale greater than one time step, the lifespan of the technologies is different so that some (assumed natural) variation in moments of technology acquisition is generated. Also greenhouse keepers usually only change major technologies during the time the crops are replanted, which happens once a year during which there is no production.
Company surfaces are power law distributed - In the Westland there are a lot of ‘small’ greenhouses (around 1 hectare) and a few huge companies (around 25 hectare).
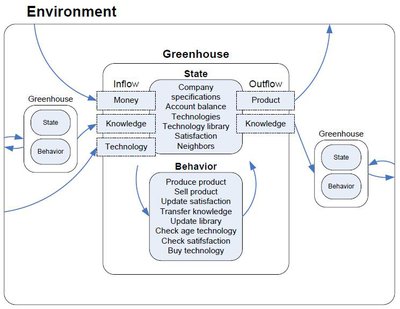
4.3 Model setup
The model is setup in such a way that all information about the existing technologies, the product sales prices and the possible company specifications is ‘owned’ by the environment. Companies are randomly assigned technologies (including technology attributes) and company specifications on the basis of which they interact with other companies. In this way the environment holds all information about the world; giving a clear overview and ease of adjustment.
