Our mission is to help computational modelers develop, document, and share their computational models in accordance with community standards and good open science and software engineering practices. Model authors can publish their model source code in the Computational Model Library with narrative documentation as well as metadata that supports open science and emerging norms that facilitate software citation, computational reproducibility / frictionless reuse, and interoperability. Model authors can also request private peer review of their computational models. Models that pass peer review receive a DOI once published.
All users of models published in the library must cite model authors when they use and benefit from their code.
Please check out our model publishing tutorial and feel free to contact us if you have any questions or concerns about publishing your model(s) in the Computational Model Library.
Displaying 10 of 123 results for "Jean-Philippe Choisis" clear search
TechNet_04: Cultural Transmission in a Spatially-Situated Network
Andrew White | Published Monday, October 08, 2012 | Last modified Saturday, April 27, 2013The TechNet_04 is an abstract model that embeds a simple cultural tranmission process in an environment where interaction is structured by spatially-situated networks.
A simulation model for Dublin city
umesh7lowe | Published Friday, April 10, 2026An agent-based model of urban travel behaviour in Dublin, Ireland, built in NetLogo and empirically grounded in 2016 travel survey data. Each agent represents a Dublin resident initialised with real socio-demographic attributes — including age, gender, household size and car ownership, income, driving licence status, and access to local amenities — alongside observed trip characteristics such as distance, travel time, and trip type (work, shopping, leisure).
At each time step, agents choose between four transport modes (car, public transport, cycling, and walking) across short, medium, and long trips. Mode choice is governed by a preference vector that weighs personal need satisfaction against social influence from neighbouring agents reflecting consumat framework. Satisfaction evolves dynamically based on cost (incorporating Irish motor tax bands and per-km operating rates), travel time, and trip-type suitability, with an uncertainty parameter capturing variability in perceived utility over time.
The model tracks aggregate modal shares and total CO2 emission at each tick, enabling exploration of how policy interventions — such as fuel taxation, public transport pricing, or active travel incentives — might shift the city’s travel demand profile over 100 simulated days.
MERCURY extension: population
Tom Brughmans | Published Thursday, May 23, 2019This model is an extended version of the original MERCURY model (https://www.comses.net/codebases/4347/releases/1.1.0/ ) . It allows for experiments to be performed in which empirically informed population sizes of sites are included, that allow for the scaling of the number of tableware traders with the population of settlements, and for hypothesised production centres of four tablewares to be used in experiments.
Experiments performed with this population extension and substantive interpretations derived from them are published in:
Hanson, J.W. & T. Brughmans. In press. Settlement scale and economic networks in the Roman Empire, in T. Brughmans & A.I. Wilson (ed.) Simulating Roman Economies. Theories, Methods and Computational Models. Oxford: Oxford University Press.
…
Integrate land use policies into the agent-based model to simulate land use change
Jing Gao | Published Sunday, June 09, 2024This study employs a hierarchical cross-departmental ABM to explore the question: How and to what extent are the land use policies enforced when assessed against the real-world land use pattern? Specifically, two sub-questions are of interest: How can real-world policy interactions be abstracted into the behavior across hierarchical governmental departments in the model? How can the level of enforcement for each land use policy be quantified under these interactions? We build three hierarchical agents—the central level, the local level that incorporates three departments, and the village collective level—with simplified but plausible processes of land use change, with levels of enforcement of different land use policies as key parameters. We calibrate the model using a genetic algorithm to determine those parameters and answer our research question. We further applied the model to simulate potential land use changes and investigate the implications of different policy options. The results are expected to provide insights into the intricate relationships shaping land use processes, contributing to evidence-based decision-making in urban planning and sustainable land use management.
Peer reviewed Personnel decisions in the hierarchy
Smarzhevskiy Ivan | Published Friday, August 19, 2022This is a model of organizational behavior in the hierarchy in which personnel decisions are made.
The idea of the model is that the hierarchy, busy with operations, is described by such characteristics as structure (number and interrelation of positions) and material, filling these positions (persons with their individual performance). A particular hierarchy is under certain external pressure (performance level requirement) and is characterized by the internal state of the material (the distribution of the perceptions of others over the ensemble of persons).
The World of the model is a four-level hierarchical structure, consisting of shuff positions of the top manager (zero level of the hierarchy), first-level managers who are subordinate to the top manager, second-level managers (subordinate to the first-level managers) and positions of employees (the third level of the hierarchy). ) subordinated to the second-level managers. Such a hierarchy is a tree, i.e. each position, with the exception of the position of top manager, has a single boss.
Agents in the model are persons occupying the specified positions, the number of persons is set by the slider (HumansQty). Personas have some operational performance (harisma, an unfortunate attribute name left over from the first edition of the model)) and a sense of other personas’ own perceptions. Performance values are distributed over the ensemble of persons according to the normal law with some mean value and variance.
The value of perception by agents of each other is positive or negative (implemented in the model as numerical values equal to +1 and -1). The distribution of perceptions over an ensemble of persons is implemented as a random variable specified by the probability of negative perception, the value of which is set by the control elements of the model interface. The numerical value of the probability equal to 0 corresponds to the case in which all persons positively perceive each other (the numerical value of the random variable is equal to 1, which corresponds to the positive perception of the other person by the individual).
The hierarchy is occupied with operational activity, the degree of intensity of which is set by the external parameter Difficulty. The level of productivity of each manager OAIndex is equal to the level of productivity of the department he leads and is the ratio of the sum of productivity of employees subordinate to the head to the level of complexity of the work Difficulty. An increase in the numerical value of Difficulty leads to a decrease in the OAIndex for all subdivisions of the hierarchy. The managerial meaning of the OAIndex indicator is the percentage of completion of the load specified for the hierarchy as a whole, i.e. the ratio of the actual performance of the structural subdivisions of the hierarchy to the required performance, the level of which is specified by the value of the Difficulty parameter.
…
The various technologies used inside a Dutch greenhouse interact in combination with an external climate, resulting in an emergent internal climate, which contributes to the final productivity of the greenhouse. This model examines how differing technology development styles affects the overall ability of a community of growers to approach the theoretical maximum yield.
WeDiG Sim
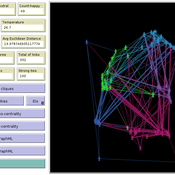
Reza Shamsaee | Published Monday, May 14, 2012 | Last modified Saturday, April 27, 2013WeDiG Sim- Weighted Directed Graph Simulator - is an open source application that serves to simulate complex systems. WeDiG Sim reflects the behaviors of those complex systems that put stress on scale-free, weightedness, and directedness. It has been implemented based on “WeDiG model” that is newly presented in this domain. The WeDiG model can be seen as a generalized version of “Barabási-Albert (BA) model”. WeDiG not only deals with weighed directed systems, but also it can handle the […]
ABM for Underwater optical wireless communication in a water tank
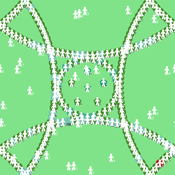
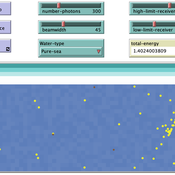
Mohamed ABID | Published Sunday, May 29, 2022This model simulates the propagation of photons in a water tank. A source of light emits an impulse of photons with equal energy represented by yellow dots. These photons are then scattered by water particles before possibly reaching the photo-detector represented by a gray line. Different types of water are considered. For each one of them we calculate the total received energy.
The water tank is represented by a blue rectangle with fixed dimensions. It’s exposed to the air interface and has totally absorbent barriers. Four types of water are supported. Each one is characterized by its absorption and scattering coefficients.
At the source, the photons are generated uniformly with a random direction within the beamwidth. Each photon travels a random distance drawn from a distribution depending on the water characteristics before encountering a water particle.
Based on the updated position of the photon, three situations may occur:
-The photon hits the barrier of the tank on its trajectory. In this case it’s considered as lost since the barriers are assumed totally absorbent.
…
Artificial Long House Valley-Black Mesa
Lisa Sattenspiel Amy Warren | Published Thursday, March 19, 2020This model is an extension of the Artificial Long House Valley (ALHV) model developed by the authors (Swedlund et al. 2016; Warren and Sattenspiel 2020). The ALHV model simulates the population dynamics of individuals within the Long House Valley of Arizona from AD 800 to 1350. Individuals are aggregated into households that participate in annual agricultural and demographic cycles. The present version of the model incorporates features of the ALHV model including realistic age-specific fertility and mortality and, in addition, it adds the Black Mesa environment and population, as well as additional methods to allow migration between the two regions.
As is the case for previous versions of the ALHV model as well as the Artificial Anasazi (AA) model from which the ALHV model was derived (Axtell et al. 2002; Janssen 2009), this version makes use of detailed archaeological and paleoenvironmental data from the Long House Valley and the adjacent areas in Arizona. It also uses the same methods as the original AA model to estimate annual maize productivity of various agricultural zones within the Long House Valley. A new environment and associated methods have been developed for Black Mesa. Productivity estimates from both regions are used to determine suitable locations for households and farms during each year of the simulation.
Cellular automata model of social networks
Rubens de Almeida Zimbres | Published Tuesday, August 02, 2022This project was developed during the Santa Fe course Introduction to Agent-Based Modeling 2022. The origin is a Cellular Automata (CA) model to simulate human interactions that happen in the real world, from Rubens and Oliveira (2009). These authors used a market research with real people in two different times: one at time zero and the second at time zero plus 4 months (longitudinal market research). They developed an agent-based model whose initial condition was inherited from the results of the first market research response values and evolve it to simulate human interactions with Agent-Based Modeling that led to the values of the second market research, without explicitly imposing rules. Then, compared results of the model with the second market research. The model reached 73.80% accuracy.
In the same way, this project is an Exploratory ABM project that models individuals in a closed society whose behavior depends upon the result of interaction with two neighbors within a radius of interaction, one on the relative “right” and other one on the relative “left”. According to the states (colors) of neighbors, a given cellular automata rule is applied, according to the value set in Chooser. Five states were used here and are defined as levels of quality perception, where red (states 0 and 1) means unhappy, state 3 is neutral and green (states 3 and 4) means happy.
There is also a message passing algorithm in the social network, to analyze the flow and spread of information among nodes. Both the cellular automaton and the message passing algorithms were developed using the Python extension. The model also uses extensions csv and arduino.
Displaying 10 of 123 results for "Jean-Philippe Choisis" clear search