About the CoMSES Model Library more info
Our mission is to help computational modelers at all levels engage in the establishment and adoption of community standards and good practices for developing and sharing computational models. Model authors can freely publish their model source code in the Computational Model Library alongside narrative documentation, open science metadata, and other emerging open science norms that facilitate software citation, reproducibility, interoperability, and reuse. Model authors can also request peer review of their computational models to receive a DOI.
All users of models published in the library must cite model authors when they use and benefit from their code.
Please check out our model publishing tutorial and contact us if you have any questions or concerns about publishing your model(s) in the Computational Model Library.
We also maintain a curated database of over 7500 publications of agent-based and individual based models with additional detailed metadata on availability of code and bibliometric information on the landscape of ABM/IBM publications that we welcome you to explore.
Displaying 10 of 918 results for "P Van Geert" clear search
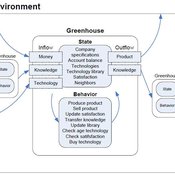
Universal Darwinism in Dutch Greenhouses
Julia Kasmire | Published Wednesday, May 09, 2012 | Last modified Saturday, April 27, 2013An ABM, derived from a case study and a series of surveys with greenhouse growers in the Westland, Netherlands. Experiments using this model showshow that the greenhouse horticulture industry displays diversity, adaptive complexity and an uneven distribution, which all suggest that the industry is an evolving system.
NetPlop: A moderately-featured presentation editor built in NetLogo
Patrick Steinmann | Published Saturday, March 27, 2021NetPlop is a presentation editor built entirely in NetLogo, an agent-based modelling environment. The NetPlop Editor includes a variety of tools to design slide decks, and the Viewer allows these decks to be dis-played to an enraptured audience. A key feature of NetPlop is the ability to embed agent-based models. NetPlop was developed for SIGBOVIK 2021.
An agent-based model for assessing strategies of adaptation to climate and tourism demand changes in an alpine destination
Stefano Balbi Marco Alberti | Published Monday, February 14, 2011 | Last modified Saturday, April 27, 2013The model is then used for assessing three hypothetical and contrasted infrastructure-oriented adaptation strategies for the winter tourism industry, that have been previously discussed with local stakeholders, as possible alternatives to the “business-as-usual” situation.
A model of the emergence of intersectional life course inequalities through transitions in the workplace. It explores LGBTQ citizens’ career outcomes and trajectories in relation to several mediating factors: (i) workplace discrimination; (ii) social capital; (iii) policy interventions (i.e., workplace equality, diversity, and inclusion policies); (iv) and LGBTQ employees’ behaviours in response to discrimination (i.e., moving workplaces and/or different strategies for managing the visibility of their identity).
SimDrink: An agent-based NetLogo model of young, heavy drinkers for conducting alcohol policy experiments
Nick Scott James Wilson Michael Livingston Aaron Hart David Moore Paul Dietze | Published Friday, September 25, 2015 | Last modified Thursday, October 15, 2015A proof-of-concept agent-based model ‘SimDrink’, which simulates a population of 18-25 year old heavy alcohol drinkers on a night out in Melbourne to provide a means for conducting policy experiments to inform policy decisions.
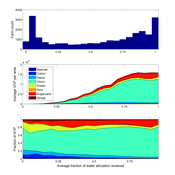
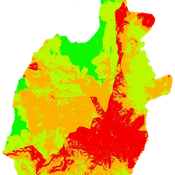
Irrigation Equity and Efficiency
Andrew Bell | Published Tuesday, August 30, 2016The purpose of this model is to examine equity and efficiency in crop production across a system of irrigated farms, as a function of maintenance costs, assessed water fees, and the capacity of farmers to trade water rights among themselves.
Peer reviewed Gregarious Behavior, Human Colonization and Social Differentiation Agent-Based Model
Gert Jan Hofstede Mark R Kramer Sebastian Fajardo Andrés Bernal Martijn de Vries | Published Thursday, August 20, 2020 | Last modified Thursday, October 29, 2020Studies of colonization processes in past human societies often use a standard population model in which population is represented as a single quantity. Real populations in these processes, however, are structured with internal classes or stages, and classes are sometimes created based on social differentiation. In this present work, information about the colonization of old Providence Island was used to create an agent-based model of the colonization process in a heterogeneous environment for a population with social differentiation. Agents were socially divided into two classes and modeled with dissimilar spatial clustering preferences. The model and simulations assessed the importance of gregarious behavior for colonization processes conducted in heterogeneous environments by socially-differentiated populations. Results suggest that in these conditions, the colonization process starts with an agent cluster in the largest and most suitable area. The spatial distribution of agents maintained a tendency toward randomness as simulation time increased, even when gregariousness values increased. The most conspicuous effects in agent clustering were produced by the initial conditions and behavioral adaptations that increased the agent capacity to access more resources and the likelihood of gregariousness. The approach presented here could be used to analyze past human colonization events or support long-term conceptual design of future human colonization processes with small social formations into unfamiliar and uninhabited environments.
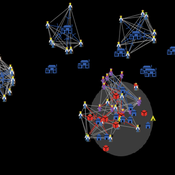
The Effect of Individual and Collective Characteristics on Team Performance: A Model of Networked Agents Engaged in Collective Problem Solving
Amin Boroomand | Published Tuesday, March 16, 2021 | Last modified Monday, July 26, 2021This code is for an agent-based model of collective problem solving in which agents with different behavior strategies, explore the NK landscape while they communicate with their peers agents. This model is based on the famous work of Lazer, D., & Friedman, A. (2007), The network structure of exploration and exploitation.
Peer reviewed Egalitarian sharing
Marcos Pinheiro | Published Friday, January 27, 2023The model explores food distribution patterns that emerge in a small-scale non-agricultural group when individuals follow a set of spatially explicit sharing interaction rules derived from a theory on the evolution of the egalitarian social instinct.
Emerging innovation niches model
Antonio Lopolito Richard Taylor Piergiuseppe Morone | Published Monday, September 22, 2014Objective of our model is to simulate the emergence and operation of a technological niches (TN) in terms of actors’ interaction. A TN can be conceived as protected socio-economic space where radical innovations are developed and tested
Displaying 10 of 918 results for "P Van Geert" clear search