About the CoMSES Model Library more info
Our mission is to help computational modelers at all levels engage in the establishment and adoption of community standards and good practices for developing and sharing computational models. Model authors can freely publish their model source code in the Computational Model Library alongside narrative documentation, open science metadata, and other emerging open science norms that facilitate software citation, reproducibility, interoperability, and reuse. Model authors can also request peer review of their computational models to receive a DOI.
All users of models published in the library must cite model authors when they use and benefit from their code.
Please check out our model publishing tutorial and contact us if you have any questions or concerns about publishing your model(s) in the Computational Model Library.
We also maintain a curated database of over 7500 publications of agent-based and individual based models with additional detailed metadata on availability of code and bibliometric information on the landscape of ABM/IBM publications that we welcome you to explore.
Displaying 10 of 27 results for "John Vandermeer" clear search
Concession Forestry Modeling
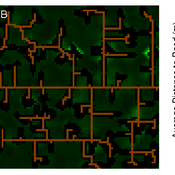
Andrew Bell Daniel G Brown Rick L Riolo Jacqueline M Doremus Thomas P Lyon John Vandermeer Arun Agrawal | Published Thursday, January 23, 2014A logging agent builds roads based on the location of high-value hotspots, and cuts trees based on road access. A forest monitor sanctions the logger on observed infractions, reshaping the pattern of road development.
The Hawk-Dove Game
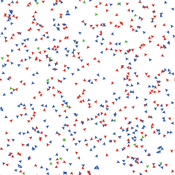
Kristin Crouse | Published Tuesday, November 05, 2019This model simulates the Hawk-Dove game as first described by John Maynard Smith, and further elaborated by Richard Dawkins in “The Selfish Gene”. In the game, two strategies, Hawks and Doves, compete against each other, and themselves, for reproductive benefits. A third strategy can be introduced, Retaliators, which act like either Hawks or Doves, depending on the context.
John Q. Public (JQP): A Model of Political Judgment and Behavior
Sung-Youn Kim | Published Monday, March 14, 2011 | Last modified Saturday, April 27, 2013The model integrates major theories of political judgment and behavior within the classical cognitive paradigm embedded in the ACT-R cognitive architecture. It models preferences and beliefs of political candidates, parties, and groups.
Hohokam Water Management Simulation (HWM)
John Murphy | Published Wednesday, August 31, 2011 | Last modified Saturday, April 27, 2013Simulation of irrigation system management using archaeological data from southern Arizona
Simulating Water, Individuals, and Management (SWIM)
John Murphy | Published Friday, July 05, 2019SWIM is a simulation of water management, designed to study interactions among water managers and customers in Phoenix and Tucson, Arizona. The simulation can be used to study manager interaction in Phoenix, manager and customer messaging and water conservation in Tucson, and when coupled to the Water Balance Model (U New Hampshire), impacts of management and consumer choices on regional hydrology.
Publications:
Murphy, John T., Jonathan Ozik, Nicholson T. Collier, Mark Altaweel, Richard B. Lammers, Alexander A. Prusevich, Andrew Kliskey, and Lilian Alessa. “Simulating Regional Hydrology and Water Management: An Integrated Agent-Based Approach.” Winter Simulation Conference, Huntington Beach, CA, 2015.
EthnoCultural Tag model (ECT)
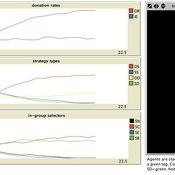
Bruce Edmonds David Hales | Published Friday, October 16, 2015 | Last modified Wednesday, May 09, 2018Captures interplay between fixed ethnic markers and culturally evolved tags in the evolution of cooperation and ethnocentrism. Agents evolve cultural tags, behavioural game strategies and in-group definitions. Ethnic markers are fixed.
Peer reviewed Industrial Symbiosis Network implementation ABM
Igor Nikolic Kasper Pieter Hendrik Lange Gijsbert Korevaar Paulien Herder | Published Tuesday, December 01, 2020 | Last modified Wednesday, June 16, 2021The purpose of the model is to explore the influence of actor behaviour, combined with environment and business model design, on the survival rates of Industrial Symbiosis Networks (ISN), and the cash flows of the agents. We define an ISN to be robust, when it is able to run for 10 years, without falling apart due to leaving agents.
The model simulates the implementation of local waste exchange collaborations for compost production, through the ISN implementation stages of awareness, planning, negotiation, implementation, and evaluation.
One central firm plays the role of waste processor in a local composting initiative. This firm negotiates with other firms to become a supplier of their organic residual streams. The waste suppliers in the model can decide to join the initiative, or to have the waste brought to the external waste incinerator. The focal point of the model are the company-level interactions during the implementation or ending of synergies.
…
Peer reviewed TRANSOPE: a multi-agent model to simulate outsourcing networks in road freight transport.
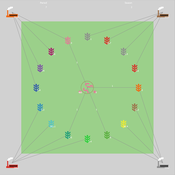
Aitor Salas-Peña Blanca Rosa Cases Gutiérrez | Published Friday, October 21, 2022A road freight transport (RFT) operation involves the participation of several types of companies in its execution. The TRANSOPE model simulates the subcontracting process between 3 types of companies: Freight Forwarders (FF), Transport Companies (TC) and self-employed carriers (CA). These companies (agents) form transport outsourcing chains (TOCs) by making decisions based on supplier selection criteria and transaction acceptance criteria. Through their participation in TOCs, companies are able to learn and exchange information, so that knowledge becomes another important factor in new collaborations. The model can replicate multiple subcontracting situations at a local and regional geographic level.
The succession of n operations over d days provides two types of results: 1) Social Complex Networks, and 2) Spatial knowledge accumulation environments. The combination of these results is used to identify the emergence of new logistics clusters. The types of actors involved as well as the variables and parameters used have their justification in a survey of transport experts and in the existing literature on the subject.
As a result of a preferential selection process, the distribution of activity among agents shows to be highly uneven. The cumulative network resulting from the self-organisation of the system suggests a structure similar to scale-free networks (Albert & Barabási, 2001). In this sense, new agents join the network according to the needs of the market. Similarly, the network of preferential relationships persists over time. Here, knowledge transfer plays a key role in the assignment of central connector roles, whose participation in the outsourcing network is even more decisive in situations of scarcity of transport contracts.
The model implements a model that reflects features of a rural hill village in Nepal. Key features of the model include water storage, social capital and migration of household members who then send remittances back to the village.
A Bottom-Up Simulation on Competition and Displacement of Online Interpersonal Communication Platforms
great-sage-futao | Published Tuesday, December 31, 2019 | Last modified Tuesday, December 31, 2019This model aims to simulate Competition and Displacement of Online Interpersonal Communication Platforms process from a bottom-up angle. Individual interpersonal communication platform adoption and abandonment serve as the micro-foundation of the simulation model. The evolution mode of platform user online communication network determines how present platform users adjust their communication relationships as well as how new users join that network. This evolution mode together with innovations proposed by individual interpersonal communication platforms would also have impacts on the platform competition and displacement process and result by influencing individual platform adoption and abandonment behaviors. Three scenes were designed to simulate some common competition situations occurred in the past and current time, that two homogeneous interpersonal communication platforms competed with each other when this kind of platforms first came into the public eye, that a late entrant platform with a major innovation competed with the leading incumbent platform during the following days, as well as that both the leading incumbent and the late entrant continued to propose many small innovations to compete in recent days, respectively.
Initial parameters are as follows: n(Nmax in the paper), denotes the final node number of the online communication network node. mi (m in the paper), denotes the initial degree of those initial network nodes and new added nodes. pc(Pc in the paper), denotes the proportion of links to be removed and added in each epoch. pst(Pv in the paper), denotes the proportion of nodes with a viscosity to some platforms. comeintime(Ti in the paper), denotes the epoch when Platform 2 joins the market. pit(Pi in the paper), denotes the proportion of nodes adopting Platform 2 immediately at epoch comeintime(Ti). ct(Ct in the paper), denotes the Innovation Effective Period length. In Scene 2, There is only one major platform proposed by Platform 2, and ct describes that length. However, in Scene 3, Platform 2 and 1 will propose innovations alternately. And so, we set ct=10000 in simulation program, and every jtt epochs, we alter the innovation proposer from one platform to the other. Hence in this scene, jtt actually denotes the Innovation Effective Period length instead of ct.
Displaying 10 of 27 results for "John Vandermeer" clear search
