Our mission is to help computational modelers develop, document, and share their computational models in accordance with community standards and good open science and software engineering practices. Model authors can publish their model source code in the Computational Model Library with narrative documentation as well as metadata that supports open science and emerging norms that facilitate software citation, computational reproducibility / frictionless reuse, and interoperability. Model authors can also request private peer review of their computational models. Models that pass peer review receive a DOI once published.
All users of models published in the library must cite model authors when they use and benefit from their code.
Please check out our model publishing tutorial and feel free to contact us if you have any questions or concerns about publishing your model(s) in the Computational Model Library.
Displaying 10 of 164 results for "Jos%C3%A9 I Santos" clear search
Model of a Socioterritorial complex system - The Southern Rural Territory of Sergipe
Marcos Aurélio Santos da Silva | Published Friday, May 18, 2018The model represents a set of social actors engaged into a collegiate (composed of representants of civil society and public sector) to manage the Southern Rural Territory of Sergipe (SRTS), created by two territorial public policies, the National Program for the Sustainable Development of Rural Territories (PRONAT) and the Program Territories of Citizenship (PTC) which aim at balancing power relations between social actors of Rural Territories. The main gola of these public policies is to empower the civil society engaged in the territory to enable them to negotiate with the traditional power (mainly majors). It was designed two models of the SRTS, one that represents the situation in 2012, and other that represents the social interdependencies in 2017. For each period it is possible to measure the capability and power of each modeled social actor and see whether it is observed the empowerment of the civil society or not.
Stylized Spatial-Social Subsystem based on Luhmann's theory (S4Luhmann)
Marcos Aurélio Santos da Silva | Published Saturday, April 06, 2019The model proposes a translation of some Luhmann’s concepts (social sub-system, perturbation, dissipation, social communication and power) into a model using a stylized spatial-society as a metaphor of a Luhmann’s social subsystem. The model has been used to improve the social theory understanding and to evaluate the effect of different parameterization in the global stabilization and individual/social power distribution.
Models for assessing empowerment through public policies in rural areas in Brazil
Marcos Aurélio Santos da Silva | Published Monday, April 08, 2019Brazil has initiated two territorial public policies for a rural sustainable development, the National Program for Sustainable Development of the Rural Territories (PRONAT) and Citizenship Territory Program (PTC). These public policies aims, as a condition for its effectiveness, the equilibrium of the power relations between actors which participate in the Collegiate for Territorial Development (CODETER) of each Rural Territory. Our research studies the hypotheses that, in the Rural Territories submitted to the PRONAT and PTC public policies, the power and reciprocity relations between actors engaged in the CODETER effectively have evolved in favor of the civil society representatives to the detriment of the public powers, notably the mayors.
The SocLab approach has been applied in two case studies and four models representing the Southern Rural Territory of Sergipe (TRSS) and the São Francisco Rural Territory (TRBSF) were designed for two referential periods, 2008-2012 and 2013-2017. These models were developed to evaluate the empowerment of the civil society in these rural territories due to thes two public policies, PRONAT and PTC.
Societal Simulator v203
Tim Gooding | Published Tuesday, October 01, 2013 | Last modified Friday, November 28, 2014Designed to capture the evolutionary forces of global society.
EU language skills
Marco Civico | Published Sunday, July 07, 2024The objective of this agent-based model is to test different language education orientations and their consequences for the EU population in terms of linguistic disenfranchisement, that is, the inability of citizens to understand EU documents and parliamentary discussions should their native language(s) no longer be official. I will focus on the impact of linguistic distance and language learning. Ideally, this model would be a tool to help EU policy makers make informed decisions about language practices and education policies, taking into account their consequences in terms of diversity and linguistic disenfranchisement. The model can be used to force agents to make certain choices in terms of language skills acquisition. The user can then go on to compare different scenarios in which language skills are acquired according to different rationales. The idea is that, by forcing agents to adopt certain language learning strategies, the model user can simulate policies promoting the acquisition of language skills and get an idea of their impact. In this way the model allows not only to sketch various scenarios of the evolution of language skills among EU citizens, but also to estimate the level of disenfranchisement in each of these scenarios.
epiworldR Type: Fast Agent-Based Epi Models
George G. Vega Yon Derek Meyer | Published Monday, August 26, 2024A flexible framework for Agent-Based Models (ABM), the ‘epiworldR’ package provides methods for prototyping disease outbreaks and transmission models using a ‘C++’ backend, making it very fast. It supports multiple epidemiological models, including the Susceptible-Infected-Susceptible (SIS), Susceptible-Infected-Removed (SIR), Susceptible-Exposed-Infected-Removed (SEIR), and others, involving arbitrary mitigation policies and multiple-disease models. Users can specify infectiousness/susceptibility rates as a function of agents’ features, providing great complexity for the model dynamics. Furthermore, ‘epiworldR’ is ideal for simulation studies featuring large populations.
Maze with Q-Learning NetLogo extension
Kevin Kons Fernando Santos | Published Tuesday, December 10, 2019This is a re-implementation of a the NetLogo model Maze (ROOP, 2006).
This re-implementation makes use of the Q-Learning NetLogo Extension to implement the Q-Learning, which is done only with NetLogo native code in the original implementation.
Cliff Walking with Q-Learning NetLogo Extension
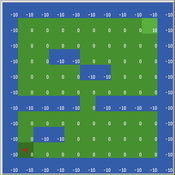
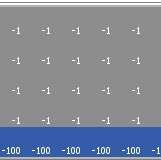
Kevin Kons Fernando Santos | Published Tuesday, December 10, 2019This model implements a classic scenario used in Reinforcement Learning problem, the “Cliff Walking Problem”. Consider the gridworld shown below (SUTTON; BARTO, 2018). This is a standard undiscounted, episodic task, with start and goal states, and the usual actions causing movement up, down, right, and left. Reward is -1 on all transitions except those into the region marked “The Cliff.” Stepping into this region incurs a reward of -100 and sends the agent instantly back to the start (SUTTON; BARTO, 2018).
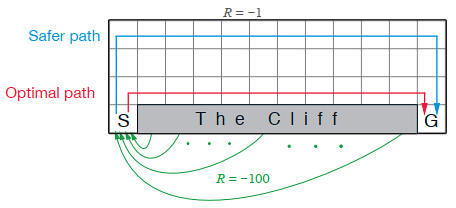
The problem is solved in this model using the Q-Learning algorithm. The algorithm is implemented with the support of the NetLogo Q-Learning Extension
MarPEM: An Agent Based Model to Explore the Effects of Policy Instruments on the Transition of the Maritime Fuel System
G Bas I Nikolic K De Boo Am Vaes - Van De Hulsbeek | Published Thursday, June 15, 2017MarPEM is an agent-based model that can be used to study the effects of policy instruments on the transition away from HFO.
Large-scale land acqusitions and smallholder food security
Tim Williams | Published Thursday, September 16, 2021Large-scale land acquisitions (LSLAs) threaten smallholder livelihoods globally. Despite more than a decade of research on the LSLA phenomenon, it remains a challenge to identify governance conditions that may foster beneficial outcomes for both smallholders and investors. One potentially promising strategy toward this end is contract farming (CF), which more directly involves smallholder households in commodity production than conditions of acquisition and displacement.
To improve understanding of how CF may mediate the outcomes of LSLAs, we developed an agent-based model of smallholder livelihoods, which we used as a virtual laboratory to experiment on a range of hypothetical LSLA and CF implementation scenarios.
The model represents a community of smallholder households in a mixed crop-livestock system. Each agent farms their own land and manages a herd of livestock. Agents can also engage in off-farm employment, for which they earn a fixed wage and compete for a limited number of jobs. The principal model outputs include measures of household food security (representing access to a single, staple food crop) and agricultural production (of a single, staple food crop).
…
Displaying 10 of 164 results for "Jos%C3%A9 I Santos" clear search